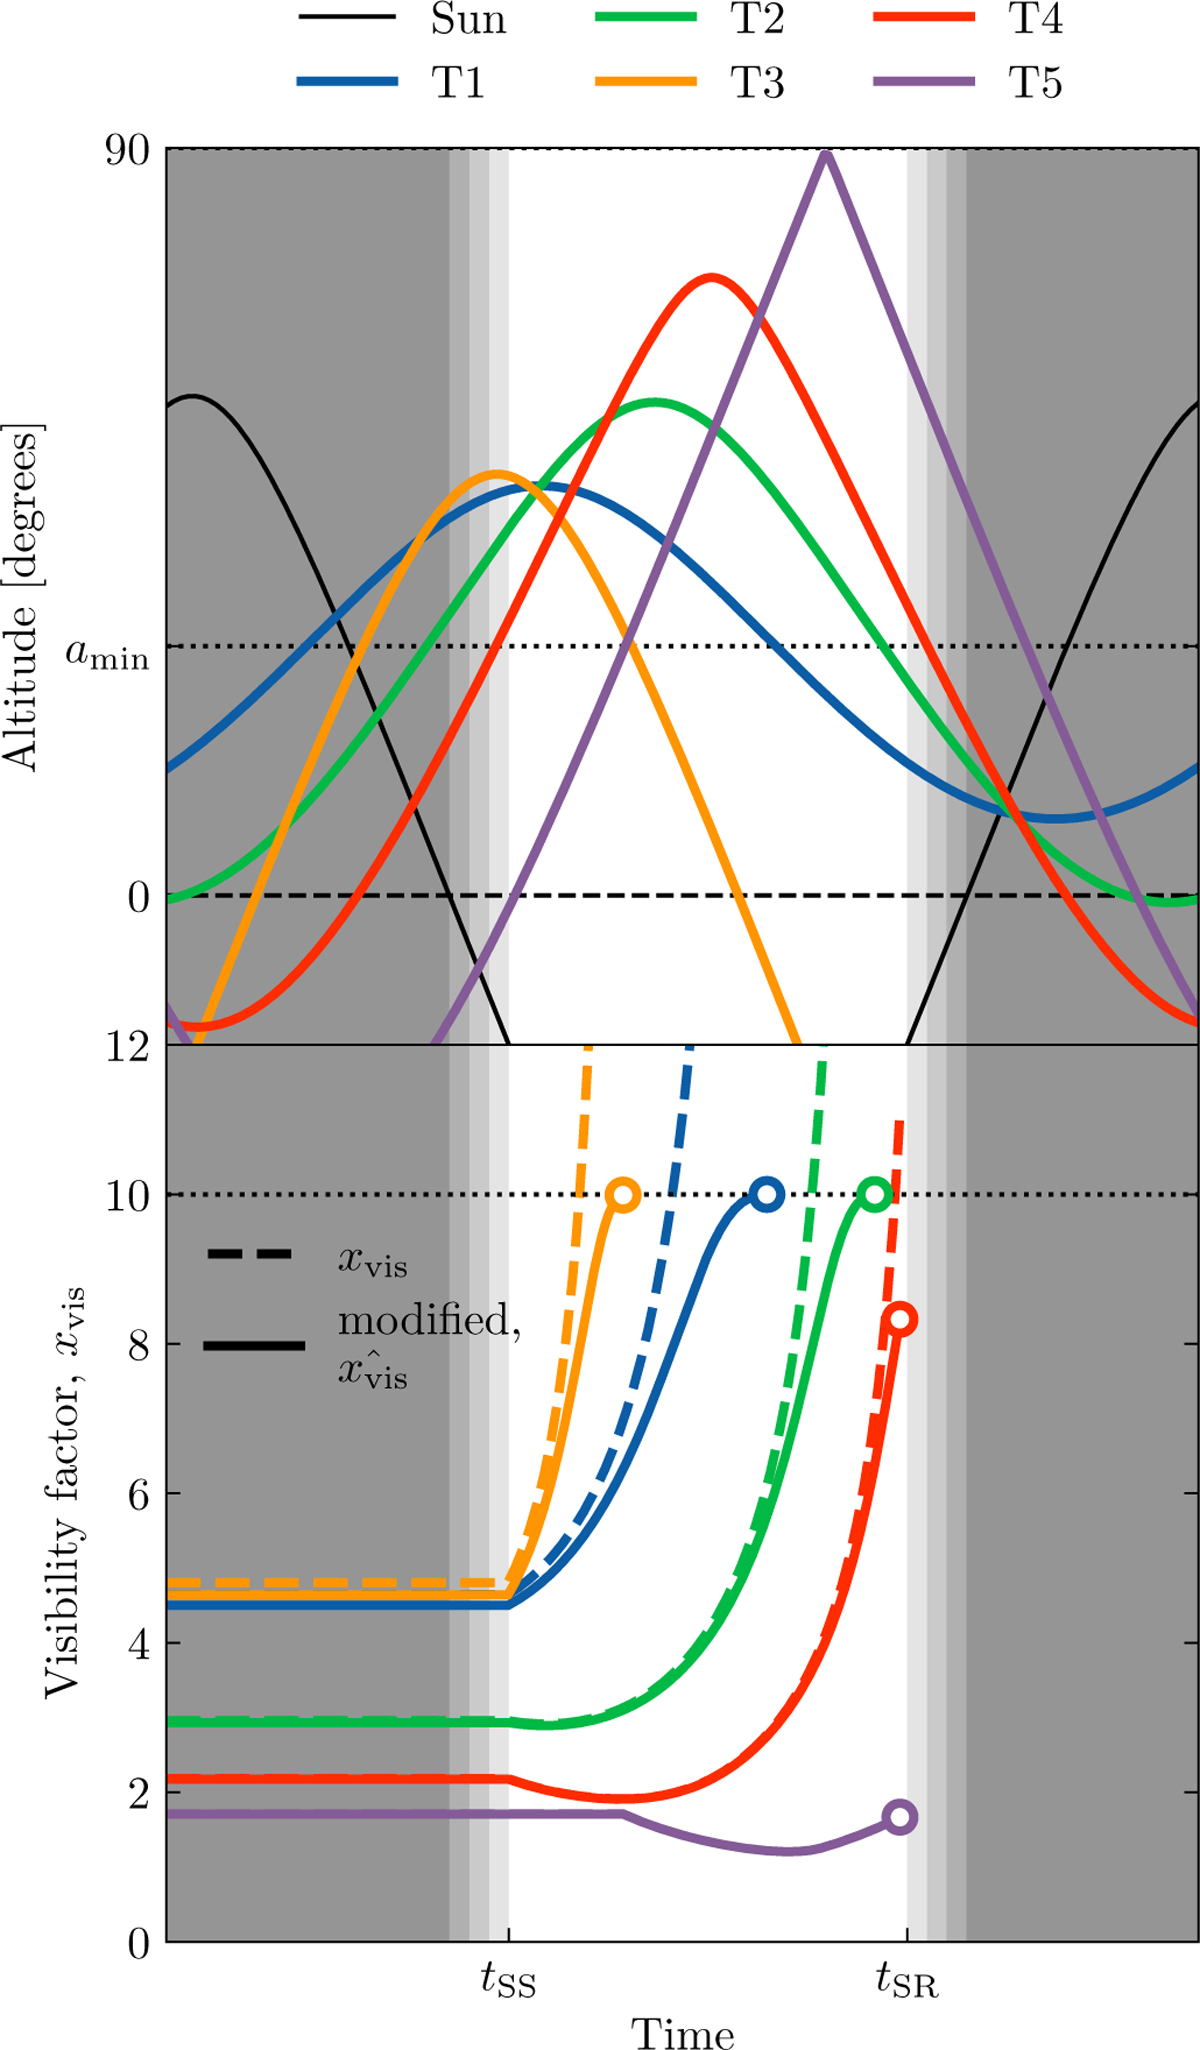
Fig. B.2
Download original image
The visibility of several hypothetical candidates during a night is shown in the upper panel. The lower panel demonstrates how the visibility factor xvis for each of these candidates changes as a function of time. The xvis definition from the main body of the paper (dashed line) has no upper limit as candidates set below amin. The modified version (Eq. B.2, solid line) ‘saturates’ to a maximum value. For this example, we have chosen A = 10 and p = 10, and aref = 90°. The white region is when the Sun is below altitude a < −18° (astronomical night). Open circles mark when the time the candidate sets below the minimum acceptable altitude, amin, or the sun rises above a = −18° (whichever is earlier).
Current usage metrics show cumulative count of Article Views (full-text article views including HTML views, PDF and ePub downloads, according to the available data) and Abstracts Views on Vision4Press platform.
Data correspond to usage on the plateform after 2015. The current usage metrics is available 48-96 hours after online publication and is updated daily on week days.
Initial download of the metrics may take a while.