Open Access
Fig. 11
Download original image
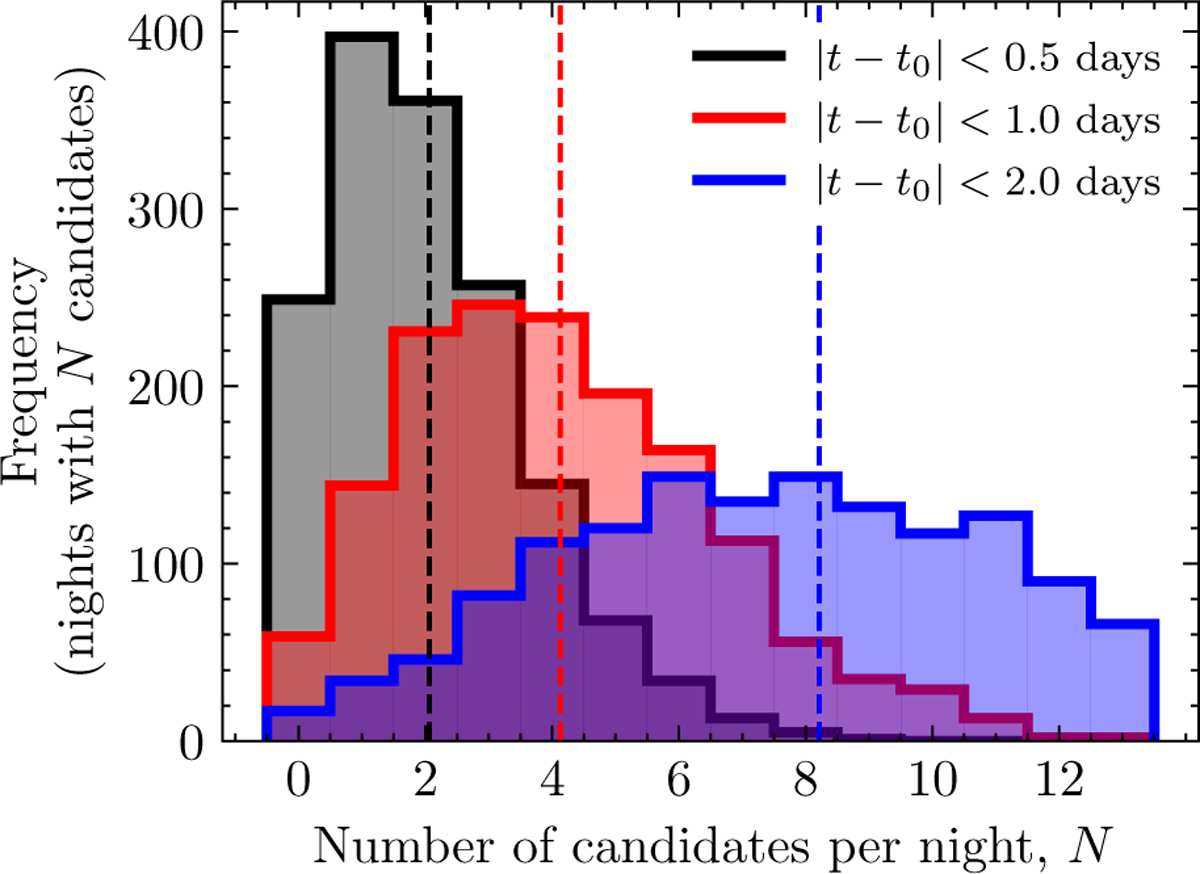
Number of expected candidates within half a day, one day and two days of the peak from simulated LSST observations. There are a mean of 2.05 ± 0.04 within 0.5 days of the true peak, 4.12 ± 0.06 within one day of the peak, and 8.2 ± 0.1 within two days of the peak (indicated by dashed vertical lines).
Current usage metrics show cumulative count of Article Views (full-text article views including HTML views, PDF and ePub downloads, according to the available data) and Abstracts Views on Vision4Press platform.
Data correspond to usage on the plateform after 2015. The current usage metrics is available 48-96 hours after online publication and is updated daily on week days.
Initial download of the metrics may take a while.