Fig. 2
Download original image
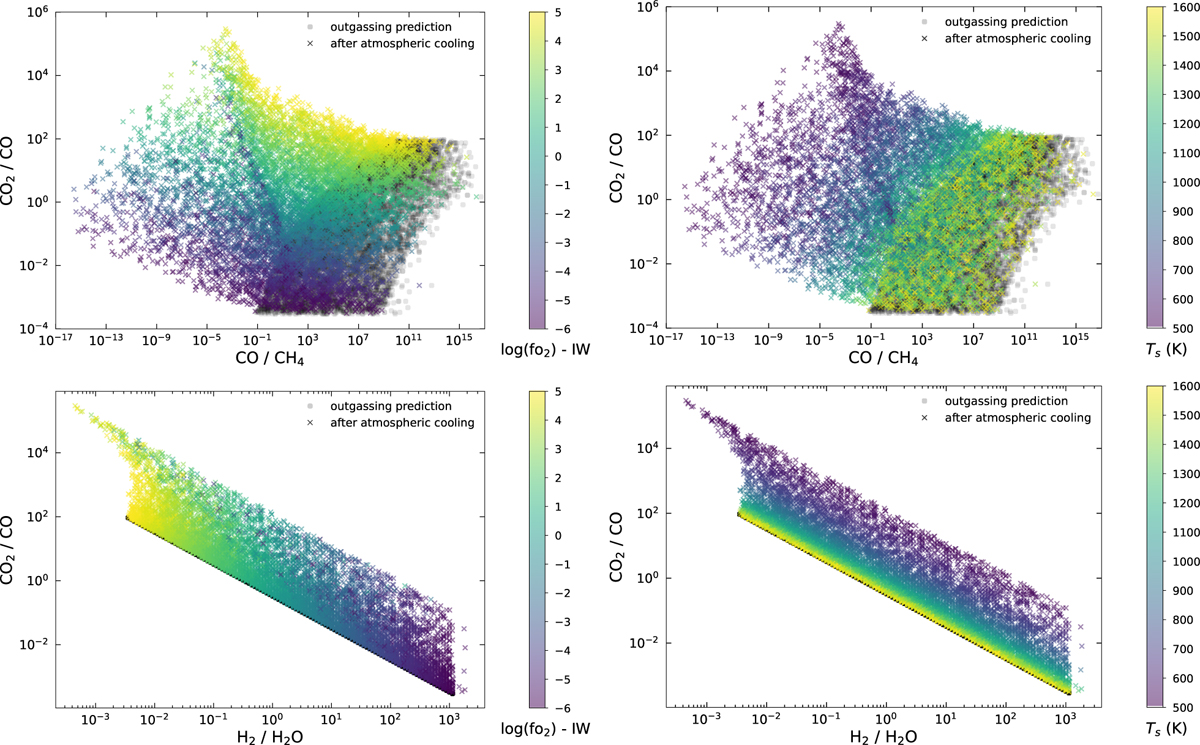
Relative molecular abundances for the different 0D simulations considering a geochemical outgassed mixture cooling to a different atmospheric surface temperature. The black dots show the prediction by outgassing alone. The colored crosses show the predictions with atmospheric cooling. The parameter space covered by these simulations is detailed in Table 1.
Current usage metrics show cumulative count of Article Views (full-text article views including HTML views, PDF and ePub downloads, according to the available data) and Abstracts Views on Vision4Press platform.
Data correspond to usage on the plateform after 2015. The current usage metrics is available 48-96 hours after online publication and is updated daily on week days.
Initial download of the metrics may take a while.