Fig. 9.
Download original image
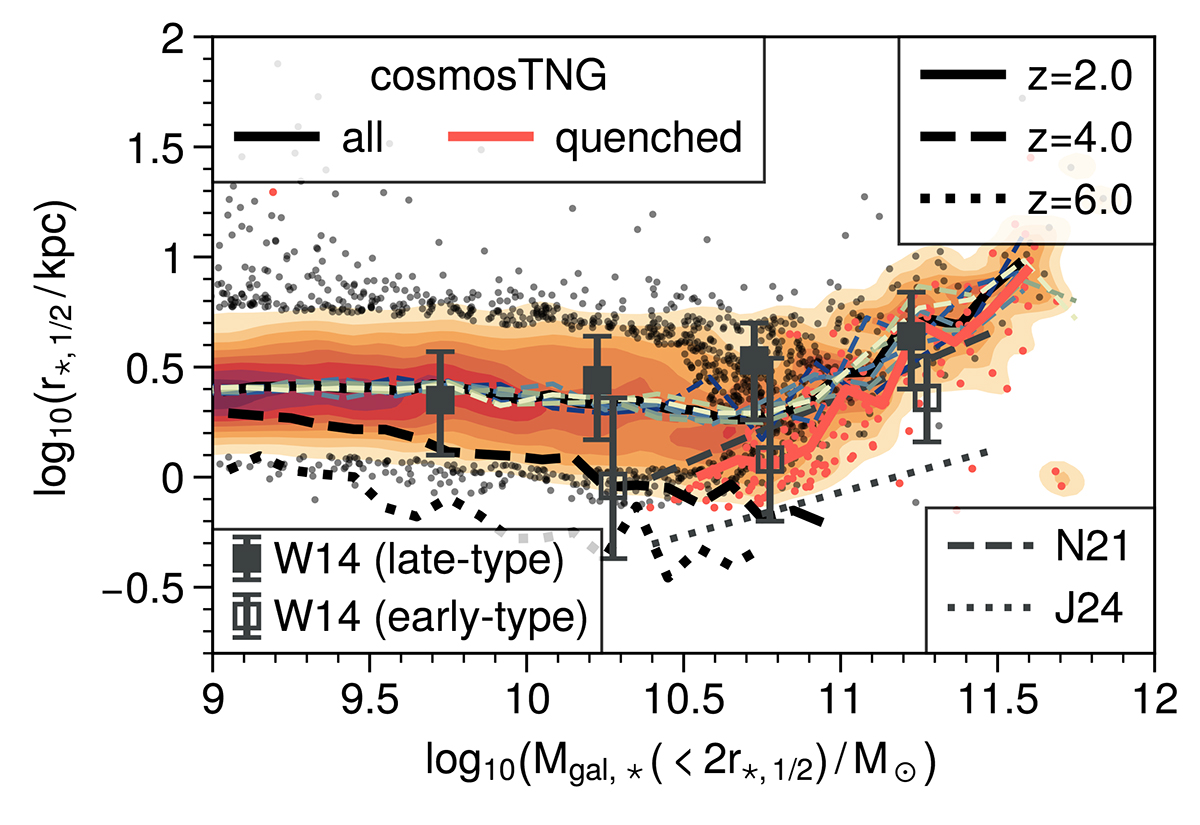
Size–mass relation in cosmosTNG at z = 2, combining all central galaxies regardless of type. The orange contours indicate the distribution of sizes at fixed stellar mass across all cosmosTNG variation runs, while the individual black points show outliers. The black line shows the median size at fixed stellar mass. The dashed (dotted) line shows the median at redshift z = 4 (z = 6), while the colored dashed lines show the individual variation runs. Finally, the red dots and the red line show quenched galaxies only (see text). We define galaxy size as twice the stellar half-mass radius, and here measure stellar masses summing all stellar populations within this radius. The observational data span z = 2.0 to z = 2.5 (van der Wel et al. 2014), where open symbols show early-type galaxies and filled symbols show late-type galaxies. Additionally, we show the linear scaling relations for quenched galaxies derived from observations Nedkova et al. (2021) and Ji et al. (2024) with gray lines. The observational data is compared as-is, without any further observational mock post-processing of cosmosTNG.
Current usage metrics show cumulative count of Article Views (full-text article views including HTML views, PDF and ePub downloads, according to the available data) and Abstracts Views on Vision4Press platform.
Data correspond to usage on the plateform after 2015. The current usage metrics is available 48-96 hours after online publication and is updated daily on week days.
Initial download of the metrics may take a while.