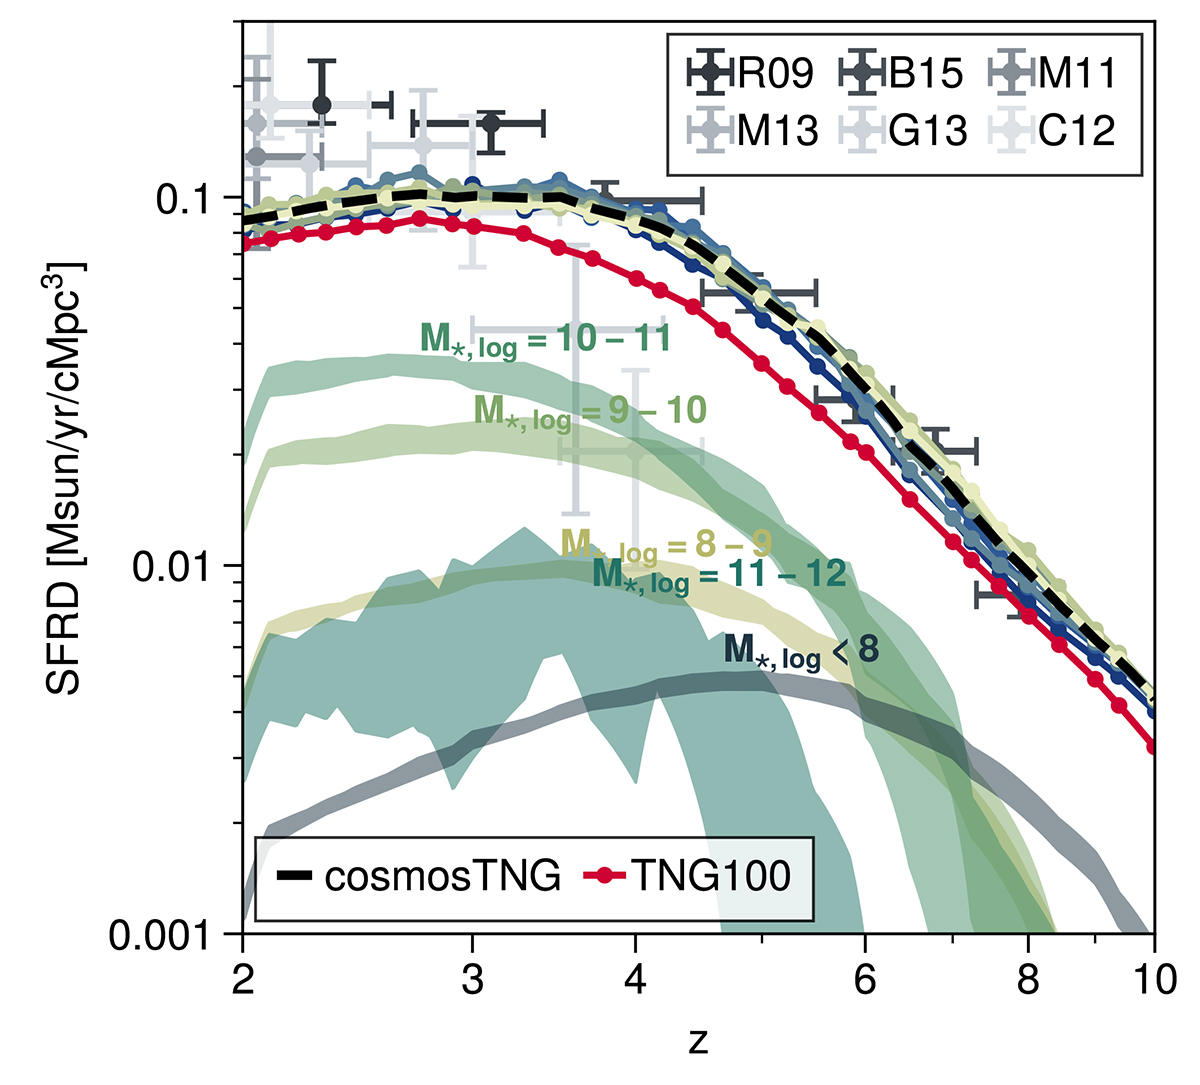
Fig. 8.
Download original image
Cosmic star formation rate density (SFRD) in cosmosTNG between z = 2 − 10. The colored lines show the individual realizations, and the black line shows the average. In red we show the TNG100 simulation for comparison. Semi-transparent bands show the range contributions of different stellar mass ranges to the overall SFRD budget across different variation runs. The gray points indicate observational data from various surveys (abbrv. R09, M11, C12, M13, G13, B15 for Reddy & Steidel 2009; Magnelli et al. 2011; Cucciati et al. 2012; Magnelli et al. 2013; Gruppioni et al. 2013; Bouwens et al. 2015), with some data from Madau & Dickinson (2014), Bouwens et al. (2015). We compare this data to cosmosTNG at face value (i.e., without replicating the procedure for the observational inferences). The SFRD of cosmosTNG is overall higher, and peaks at earlier redshift, than the field result of TNG100, suggesting that z ∼ 2.1 galaxies within this region of COSMOS have undergone a particularly active assembly history.
Current usage metrics show cumulative count of Article Views (full-text article views including HTML views, PDF and ePub downloads, according to the available data) and Abstracts Views on Vision4Press platform.
Data correspond to usage on the plateform after 2015. The current usage metrics is available 48-96 hours after online publication and is updated daily on week days.
Initial download of the metrics may take a while.