Fig. 7.
Download original image
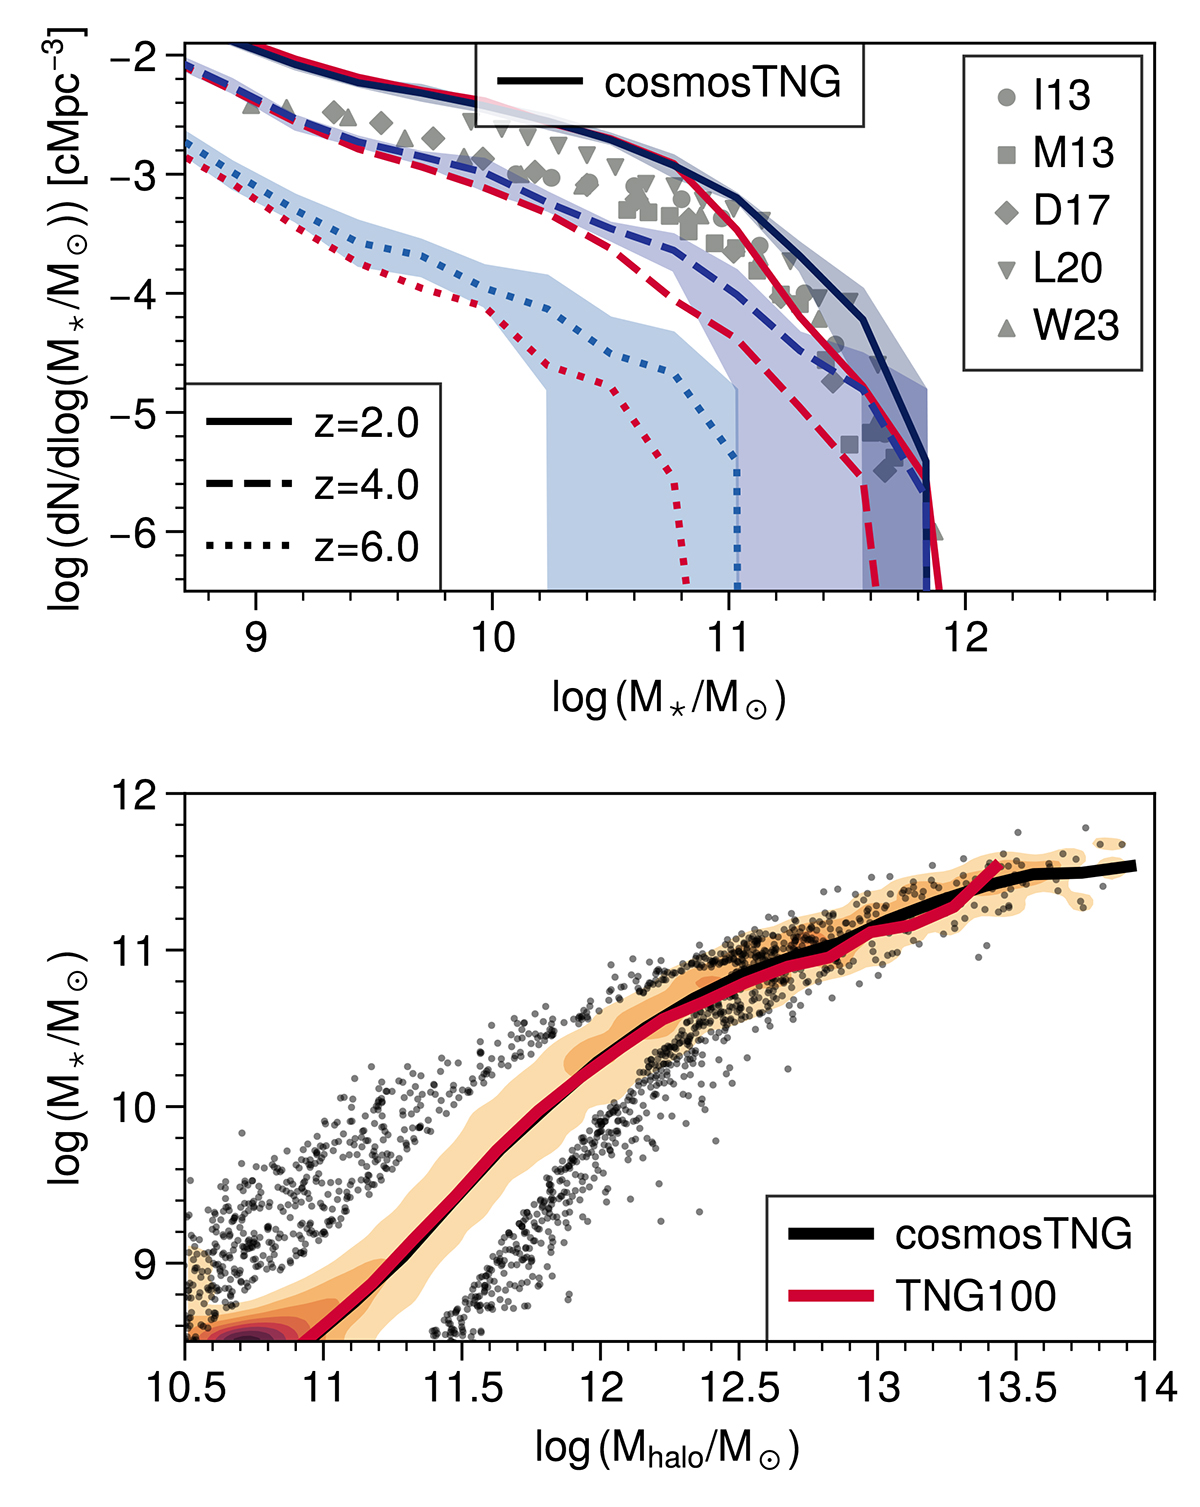
Top: Galaxy stellar mass function from cosmosTNG at redshifts z = 2, 4, 6. The semi-transparent bands span the outcomes of different variation runs with the embedded line showing the mean. In red we show the TNG100 simulation outcomes. We compare these simulations to several observational datasets (Ilbert et al. 2013; Muzzin et al. 2013; Davidzon et al. 2017; Leja et al. 2020; Weaver et al. 2023) at face value. These observations span z ∼ 2.0 − 2.5 and are shown with gray markers. In comparison to TNG100, cosmosTNG produces more high-mass galaxies above 1011 M⊙ by up to 0.5 dex. This reflects the overabundance of massive dark matter halos in this region (see text). Bottom: Relation of stellar mass to halo mass for stellar masses within the previous aperture of all central galaxies and the mass of their hosting halo at z = 2. The orange contours indicate the distribution of stellar masses at fixed halo mass across all cosmosTNG variation runs, while the individual points show galaxy outliers. The solid black (red) line shows the median stellar mass for cosmosTNG (TNG100).
Current usage metrics show cumulative count of Article Views (full-text article views including HTML views, PDF and ePub downloads, according to the available data) and Abstracts Views on Vision4Press platform.
Data correspond to usage on the plateform after 2015. The current usage metrics is available 48-96 hours after online publication and is updated daily on week days.
Initial download of the metrics may take a while.