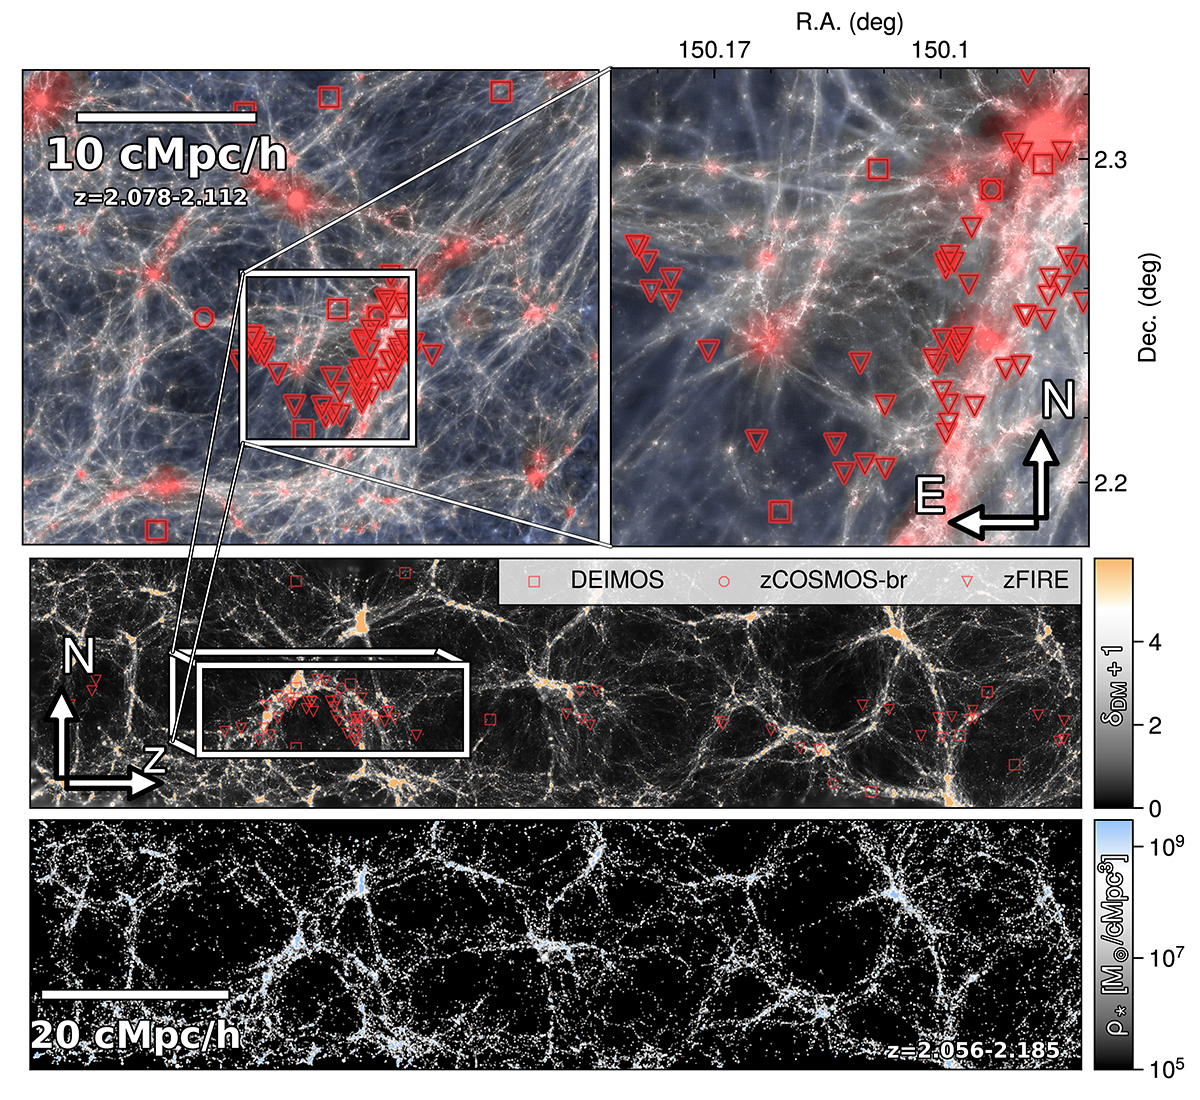
Fig. 5.
Download original image
Visual overview of the cosmosTNG-A simulation at z = 2. Top panel: Two 30 cMpc/h projections along the redshift direction with the right ascension (declination) on the x-axis (y-axis). On the left, we show the CLAMATO footprint, and on the right a zoomed-in view of a highly overdense region studied by the zFIRE survey. Both projections show a two-dimensional color map, where blue (red) indicates cold (hot) gas, and white (black) indicates high (low) density. The red symbols in the upper panels show observed galaxies from various spectroscopic surveys. Bottom panels: Dark matter and stellar density projections for a 10 cMpc/h thick slice through the simulation volume with the redshift (declination) on the x-axis (y-axis). Visually, we find that observed galaxies spatially correlate with the simulated density field down to the reconstruction scale of 1 cMpc/h. This correlation is particularly striking in the redshift direction within the zFIRE region, reproducing a characteristic arc shape of the galaxy distribution.
Current usage metrics show cumulative count of Article Views (full-text article views including HTML views, PDF and ePub downloads, according to the available data) and Abstracts Views on Vision4Press platform.
Data correspond to usage on the plateform after 2015. The current usage metrics is available 48-96 hours after online publication and is updated daily on week days.
Initial download of the metrics may take a while.