Fig. 3.
Download original image
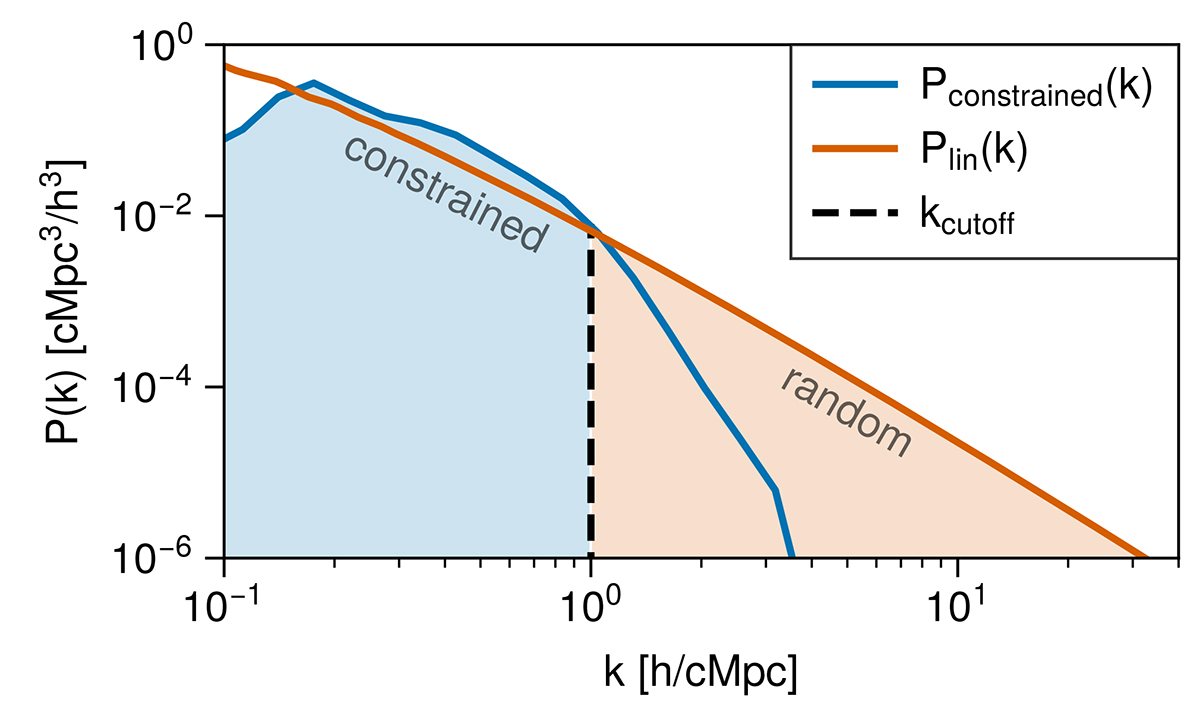
Power spectrum of the simulation volume at its initial condition (z ∼ 127). Blue shows the power of the constrained field (large scales) in the 34 × 28 × 450 cMpc3/h3 volume. Orange shows the theoretically expected linear power. The shaded region shows the composite realization for the cosmosTNG simulations: modes are from the constrained field up to kcutoff = 1 h/cMpc above which we randomly draw modes according to linear theory.
Current usage metrics show cumulative count of Article Views (full-text article views including HTML views, PDF and ePub downloads, according to the available data) and Abstracts Views on Vision4Press platform.
Data correspond to usage on the plateform after 2015. The current usage metrics is available 48-96 hours after online publication and is updated daily on week days.
Initial download of the metrics may take a while.