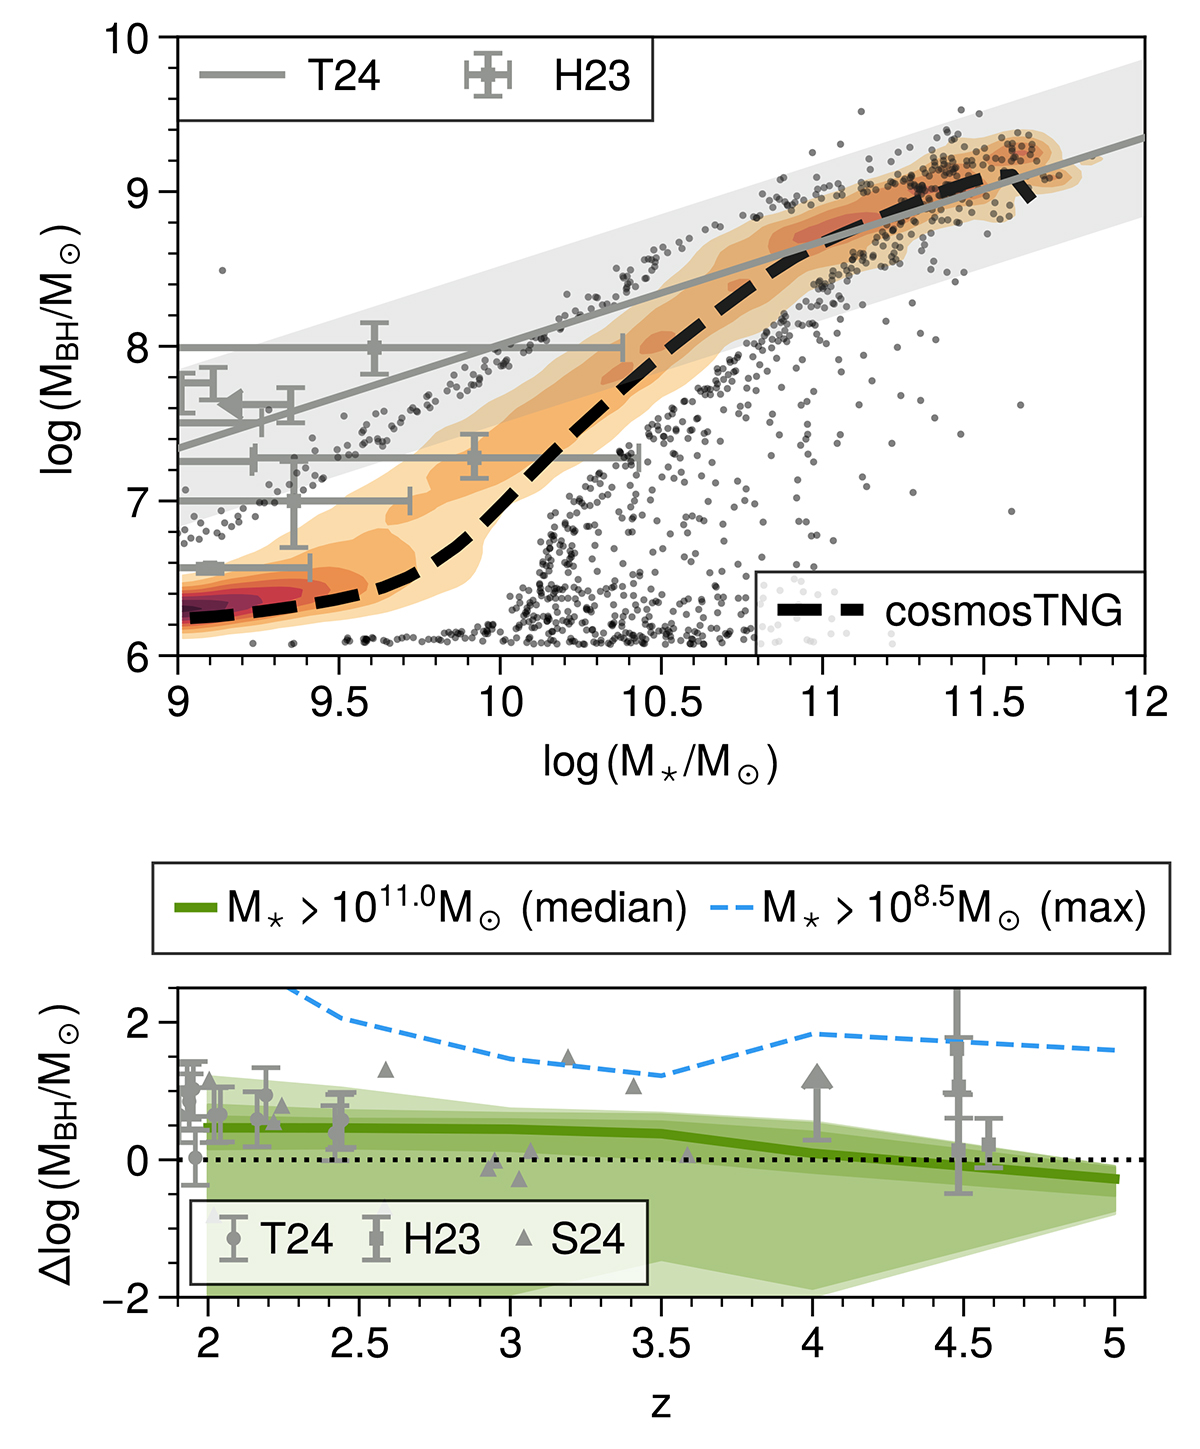
Fig. 13.
Download original image
Relation between supermassive black hole mass and galaxy stellar mass, and its evolution with time. Top: MBH–M* relation at z = 2 in cosmosTNG. The gray line shows the linear relation and the 1 − σ scatter from Tanaka et al. (2025). The annotations and markers are as in Fig. 7, bottom panel. Bottom: Evolution of the offset from the local MBH–M* relation as described in Tanaka et al. (2025) based on Häring & Rix (2004), Bennert et al. (2011) for the local relation. The points with error bars show the high-redshift observations from Harikane et al. (2023) and Tanaka et al. (2025). The gray triangles show the observations from Sun et al. (2024). All observations are compared as-is (i.e., without corrections for the respective observational methodology used when compared to cosmosTNG). The green line shows the median relation in cosmosTNG for host galaxies with M⋆ > 1011 M⊙. The shaded regions show the central 68%, 95%, and all percentiles respectively. The blue dashed line shows host galaxies with M⋆ > 108.5 M⊙. The observed galaxies with high black holes masses are rare but possible in cosmosTNG across z = 2 − 5.
Current usage metrics show cumulative count of Article Views (full-text article views including HTML views, PDF and ePub downloads, according to the available data) and Abstracts Views on Vision4Press platform.
Data correspond to usage on the plateform after 2015. The current usage metrics is available 48-96 hours after online publication and is updated daily on week days.
Initial download of the metrics may take a while.