Fig. 12.
Download original image
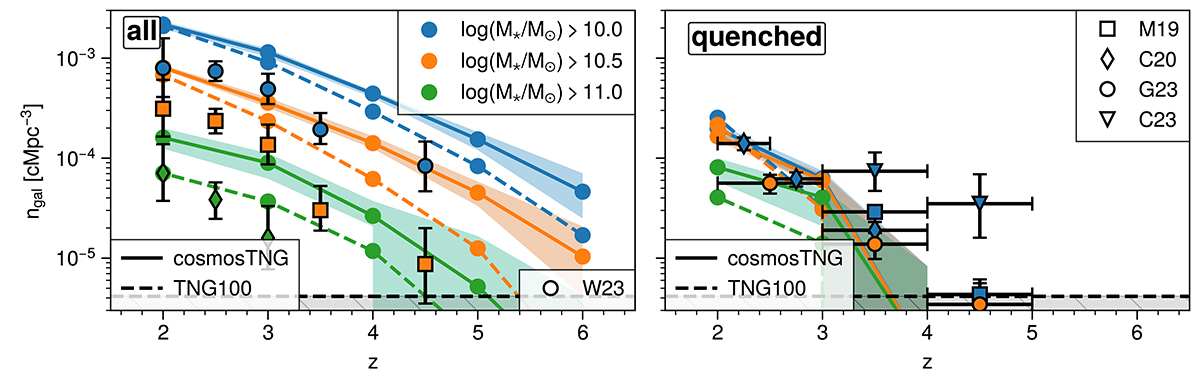
Number density of all (i.e., central and satellite) galaxies as a function of redshifts above a given stellar mass threshold in cosmosTNG-1. The shaded regions show the variation in number density across all random variations. The solid lines show the respective mean. Left: All galaxies (observational data from Weaver et al. 2023). Right: Quenched galaxies (observational data for quenched galaxy densities from Merlin et al. 2019; Carnall et al. 2020; Gould et al. 2023; Carnall et al. 2023). Observations are compared at face value without observational mock post processing of cosmosTNG. The hatched region at the bottom shows the number density 1/Vsim (i.e., one galaxy within the cosmosTNG simulation volume Vsim).
Current usage metrics show cumulative count of Article Views (full-text article views including HTML views, PDF and ePub downloads, according to the available data) and Abstracts Views on Vision4Press platform.
Data correspond to usage on the plateform after 2015. The current usage metrics is available 48-96 hours after online publication and is updated daily on week days.
Initial download of the metrics may take a while.