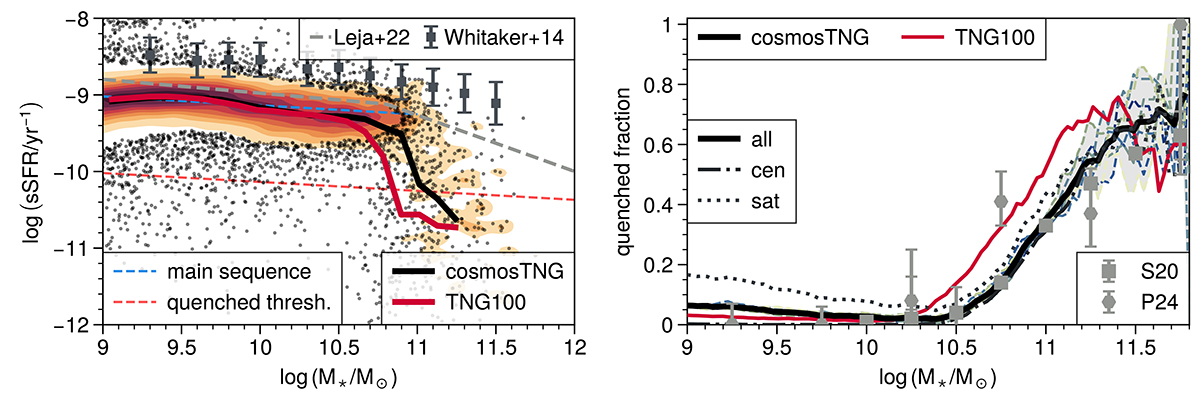
Fig. 10.
Download original image
Star formation activity of galaxies. Left: Specific star formation rate (sSFR) as a function of stellar mass for central galaxies in cosmosTNG at z = 2. The annotations and markers are as in Fig. 7, bottom panel. Measurements are within 2 arcsecond diameter apertures and with a 100 Myr averaged SFR. The gray markers show the inferred sSFR from observations in Whitaker et al. (2014). The dashed gray line shows the sSFR ridge from observational modeling in Leja et al. (2022). Right: Quenched fraction as a function of stellar mass in cosmosTNG and TNG100 at z = 2. The error bars show the observations from Sherman et al. (2020), Park et al. (2024) around cosmic noon. The observations are compared as-is (i.e., without reproducing the methodology used in the simulation). Quenched galaxies are defined as having a star formation rate at least 1 dex below the main sequence (see text). The colored lines show the individual realizations, and the dark solid line shows the average for all galaxies. The dashed (dotted) line shows the average for central (satellite) galaxies. A sizable population of quenched (central) galaxies with M⋆ > 1010.5 M⊙ is already present by z = 2. We see a lower quenching for cosmosTNG galaxies compared to TNG100.
Current usage metrics show cumulative count of Article Views (full-text article views including HTML views, PDF and ePub downloads, according to the available data) and Abstracts Views on Vision4Press platform.
Data correspond to usage on the plateform after 2015. The current usage metrics is available 48-96 hours after online publication and is updated daily on week days.
Initial download of the metrics may take a while.