Fig. 7.
Download original image
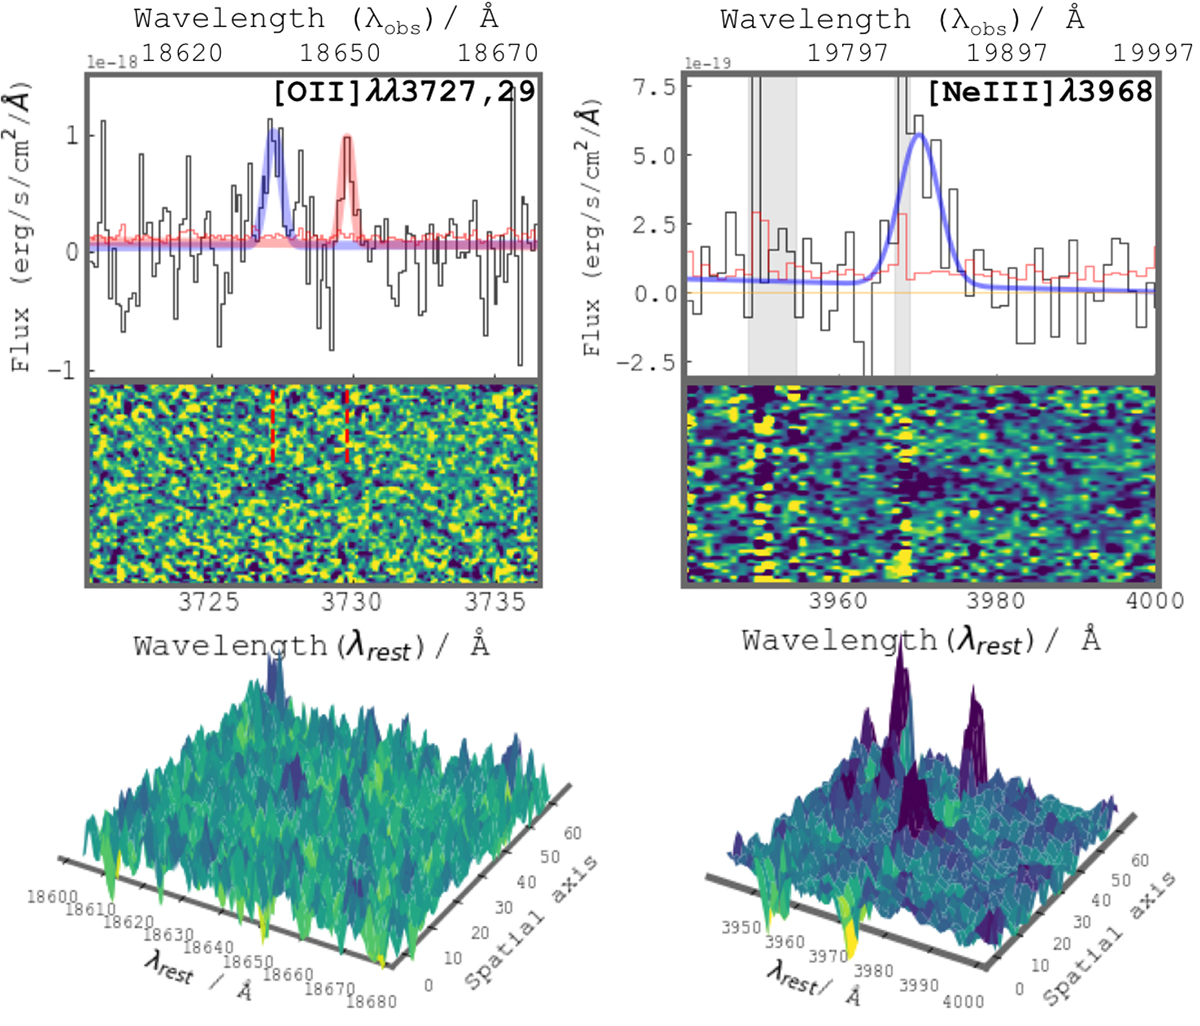
Same as Fig. 5, but for the emission [OII]λλ3727,3729 doublet and [NeIII]λ3968 line detected in X-Shooter NIR spectrum. For the [OII]λλ3727,3729 doublet, the fitted Gaussian emission lines are overplotted in blue and red, respectively. The dashed red markers in [OII] 2D spectrogram point to the faint doublet at wavelengths [OII]λλ3727,3729. Spectrum in both panels are presented in black while error in red color and zero level flux with orange line. Note: the [NeIII]λ3968 line is partially blended with the skyline (gray shaded region of ∼6 Å width). The skyline is not taken into account when fitting a Gaussian curve and calculating the integrated line flux. The 1D and 2D spectrograms are displayed in the rest- and observed-frame wavelengths.
Current usage metrics show cumulative count of Article Views (full-text article views including HTML views, PDF and ePub downloads, according to the available data) and Abstracts Views on Vision4Press platform.
Data correspond to usage on the plateform after 2015. The current usage metrics is available 48-96 hours after online publication and is updated daily on week days.
Initial download of the metrics may take a while.