Fig. 2.
Download original image
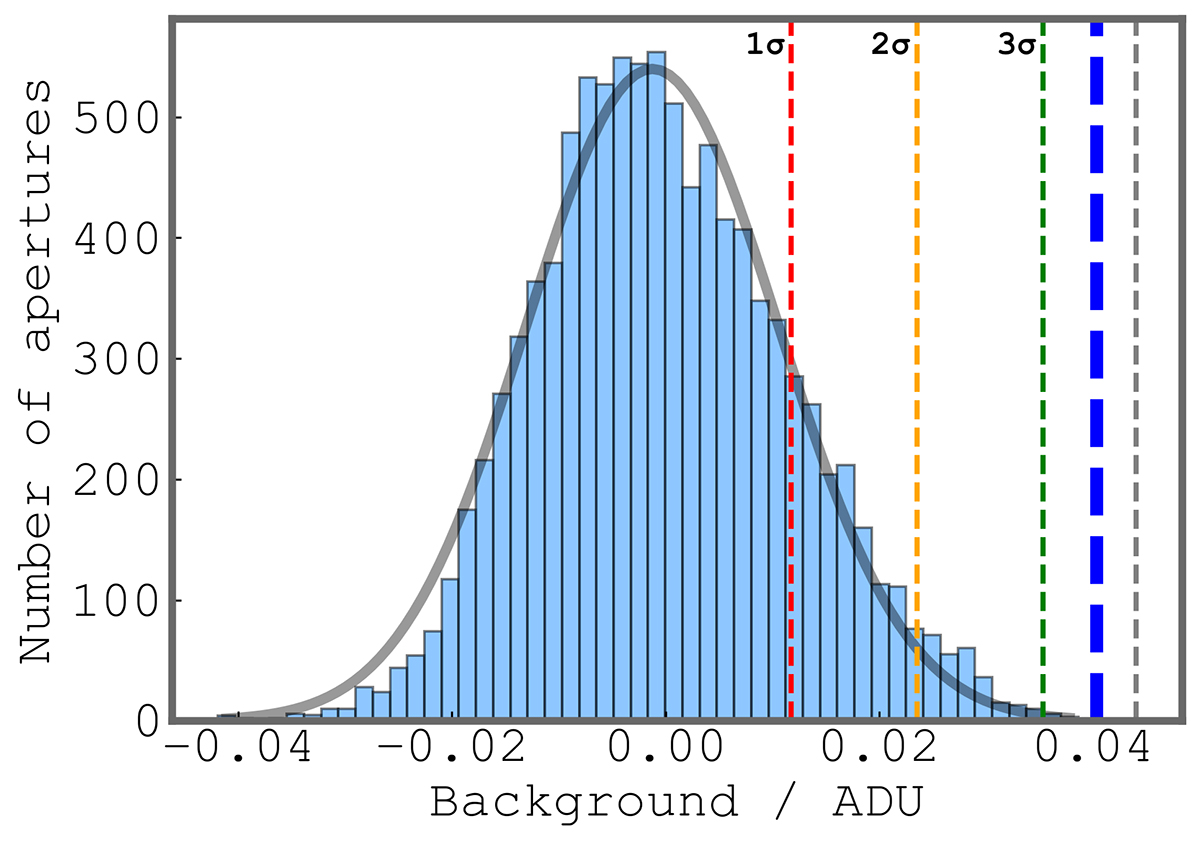
Histogram density plot of randomly placed 10 000 apertures over a 5″ × 5″ F390W image centered on Ion3. The black line is the Gaussian fit to the measured fluxes (in ADU) from 10 k apertures, with a resulting mean value of 0.001 and a 1σ of 0.0119, marked with a red dashed line (2σ and 3σ are marked with yellow and green dashed lines, respectively). The thick blue dashed line represents the background-subtracted, clean, non-contaminated LyC signal of Ion3, while thin gray dashed line is measured non-contaminated LyC signal before the background subtraction.
Current usage metrics show cumulative count of Article Views (full-text article views including HTML views, PDF and ePub downloads, according to the available data) and Abstracts Views on Vision4Press platform.
Data correspond to usage on the plateform after 2015. The current usage metrics is available 48-96 hours after online publication and is updated daily on week days.
Initial download of the metrics may take a while.