Open Access
Fig. 7.
Download original image
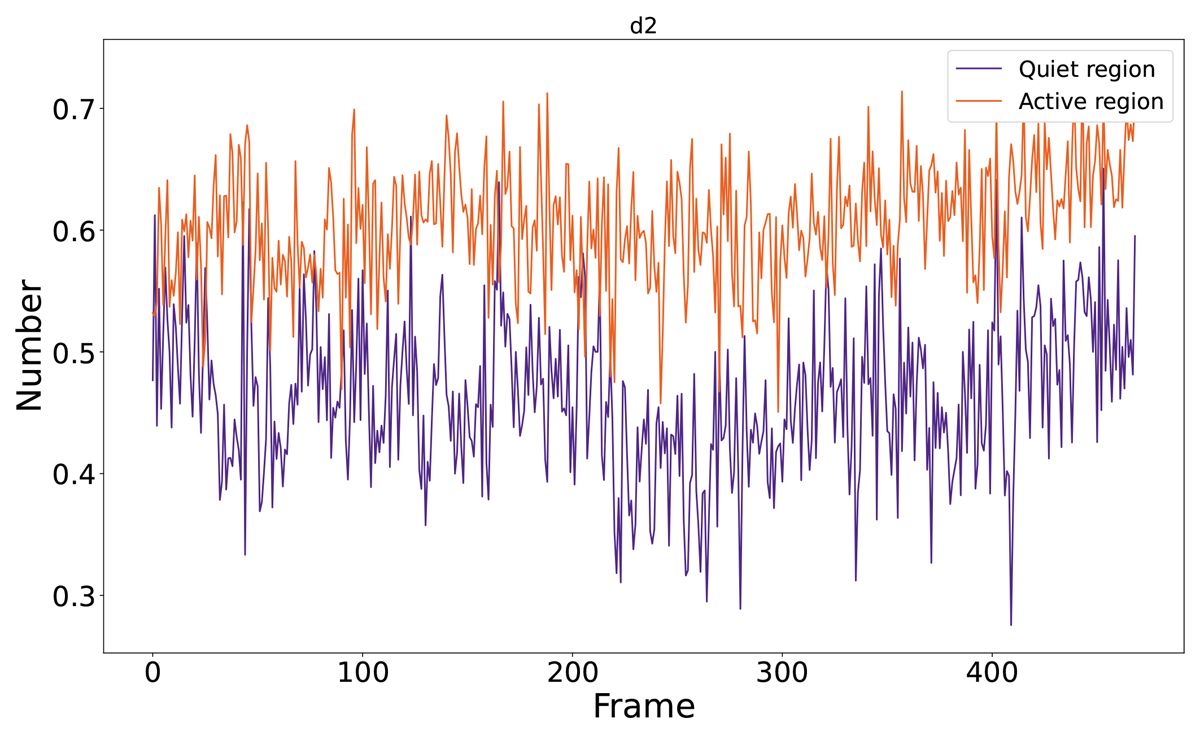
Dynamic variation curve of the relative proportion of the number of d2-sized granules. Red represents the active region, while blue represents the quiet region. In this granule size interval, the curve of the active region is above that of the quiet region.
Current usage metrics show cumulative count of Article Views (full-text article views including HTML views, PDF and ePub downloads, according to the available data) and Abstracts Views on Vision4Press platform.
Data correspond to usage on the plateform after 2015. The current usage metrics is available 48-96 hours after online publication and is updated daily on week days.
Initial download of the metrics may take a while.