Fig. 9.
Download original image
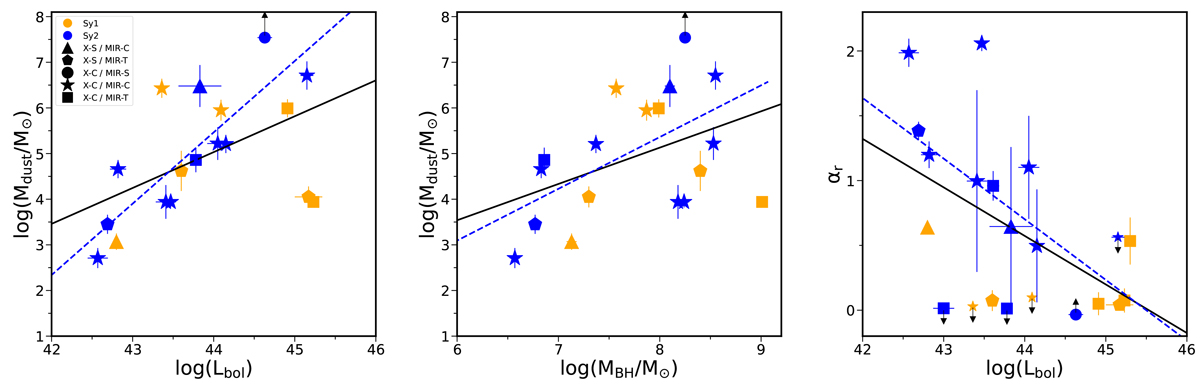
First panel: Dependence of the torus total dust mass. Middle panel: Total dust mass versus the SMBH mass. Last panel: Slope of the radial distribution. Sy1s are shown in orange, and Sy2s are shown in blue. Symbols refer to the best baseline model found for each object (see legend in Fig. 2). The solid black and dashed blue lines show the best-fit linear relation between these two quantities considering all sources and only the Sy2, respectively. Objects with upper/lower limits are shown with smaller symbols for clarity.
Current usage metrics show cumulative count of Article Views (full-text article views including HTML views, PDF and ePub downloads, according to the available data) and Abstracts Views on Vision4Press platform.
Data correspond to usage on the plateform after 2015. The current usage metrics is available 48-96 hours after online publication and is updated daily on week days.
Initial download of the metrics may take a while.