Open Access
Fig. 7.
Download original image
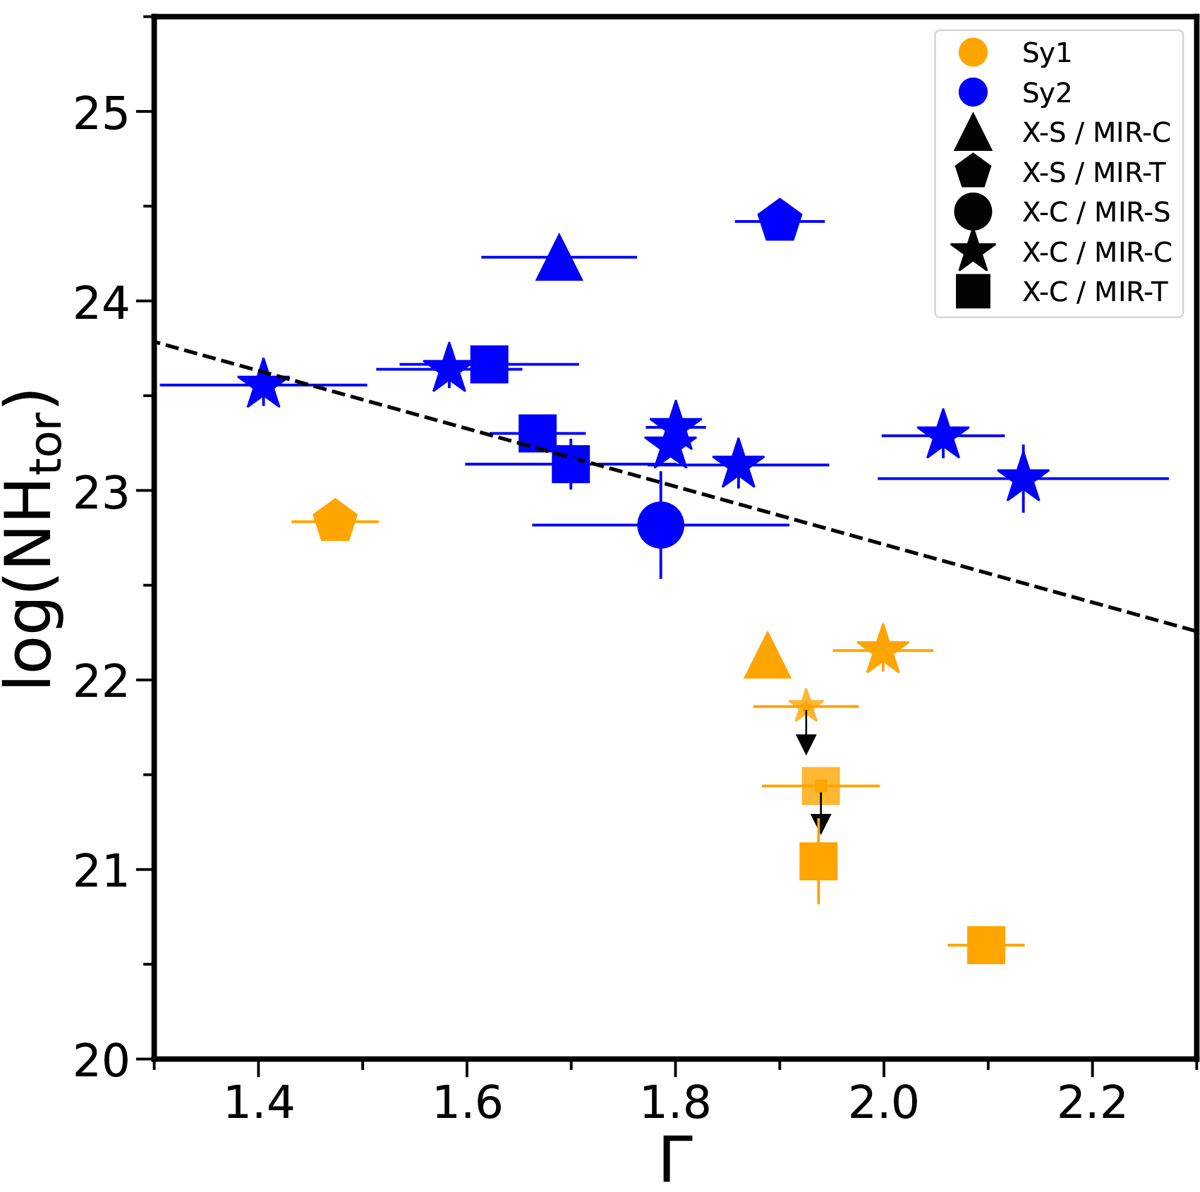
Column density of the reflector (NHtor) versus the photon index (Γ). Sy1s are shown in orange, and Sy2s are shown in blue. Different symbols are shown according to the best models used for each object (see text).
Current usage metrics show cumulative count of Article Views (full-text article views including HTML views, PDF and ePub downloads, according to the available data) and Abstracts Views on Vision4Press platform.
Data correspond to usage on the plateform after 2015. The current usage metrics is available 48-96 hours after online publication and is updated daily on week days.
Initial download of the metrics may take a while.