Fig. 5.
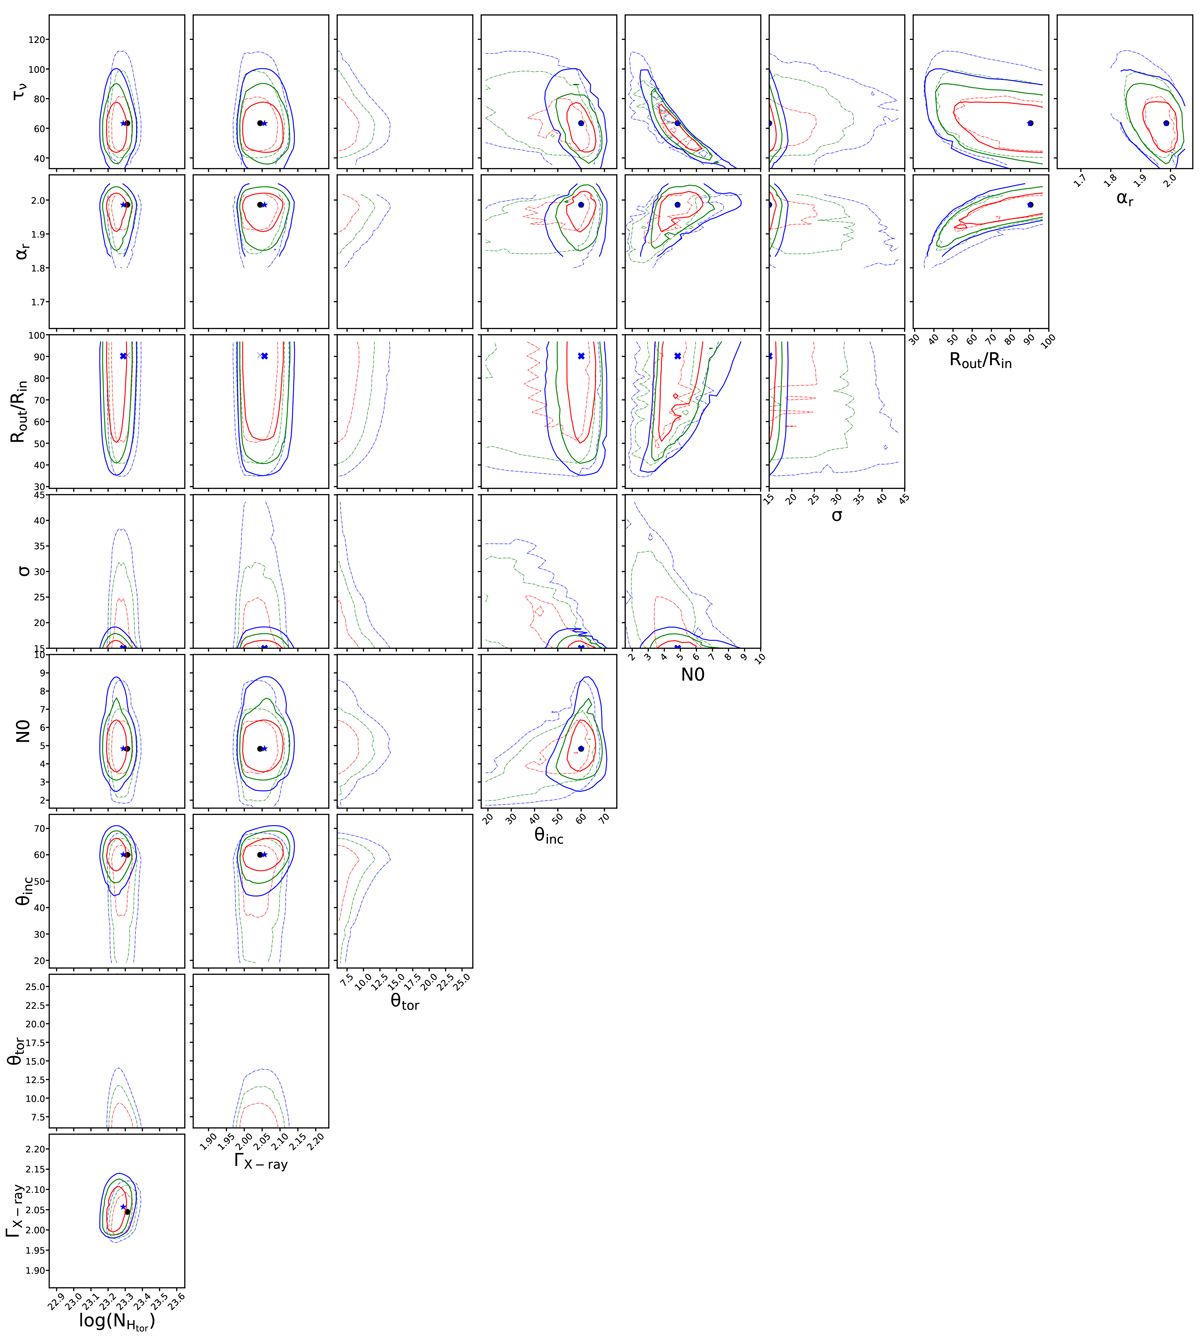
Download original image
Two-dimensional Δχ2 contours for the resulting free parameters when we used the X-C/MIR-C baseline model before (dotted lines) and after (solid lines) linking the half-opening angle and torus angular width to fit ESO 138-G01 spectra. The (dotted and solid) red, green, and blue contours mark the 1σ, 2σ, and 3σ errors, respectively. The black circles and blue stars are the resulting values for each parameter before and after linking the half-opening angle and torus angular width, respectively. These contours for the rest of the sources are available in this URL.
Current usage metrics show cumulative count of Article Views (full-text article views including HTML views, PDF and ePub downloads, according to the available data) and Abstracts Views on Vision4Press platform.
Data correspond to usage on the plateform after 2015. The current usage metrics is available 48-96 hours after online publication and is updated daily on week days.
Initial download of the metrics may take a while.