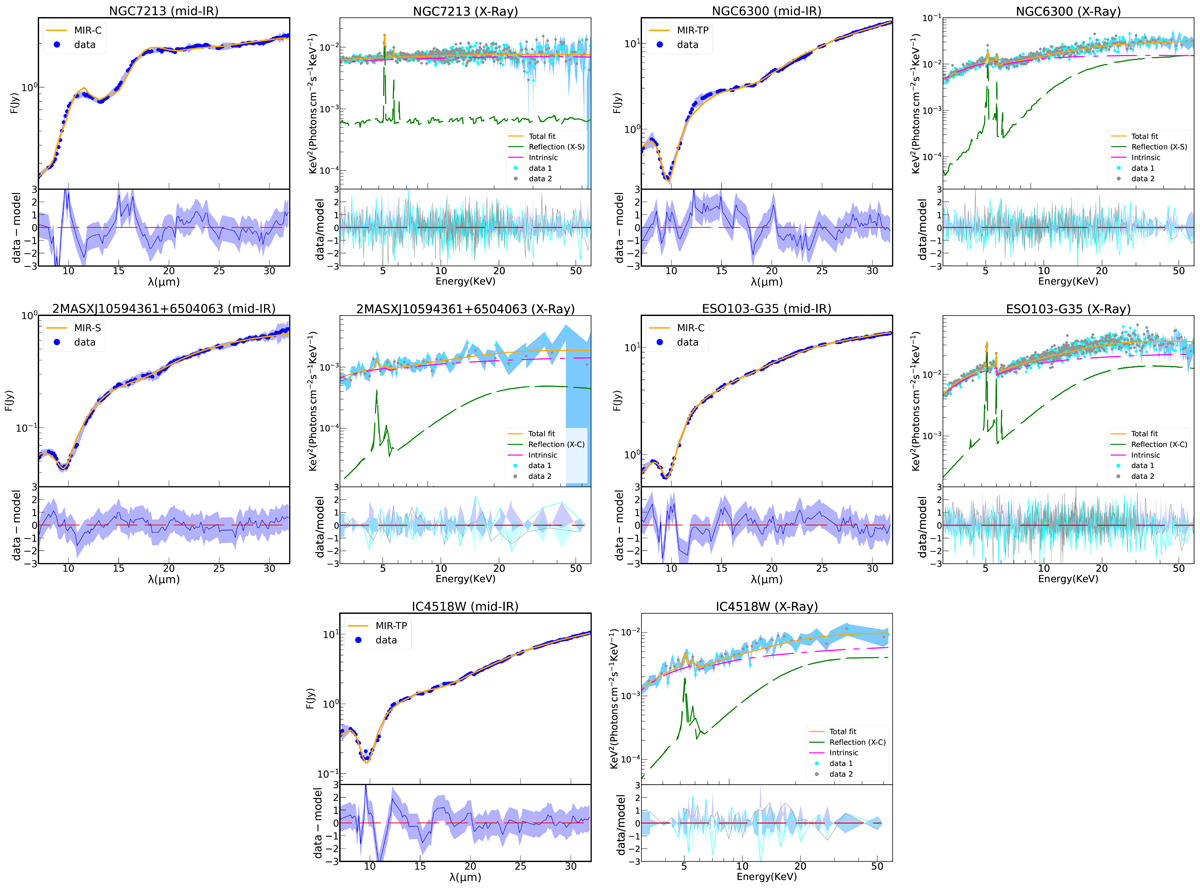
Fig. 3.
Download original image
Spectral fits of NGC 7213, NGC 6300, J10594361+6504063, ESO103-G35, and IC4518W. The solid orange lines are the best fit obtained from the X-S/MIR-C, X-S/MIR-TP, X-C/MIR-S, X-C/MIR-C, and X-C/MIR-TP baseline models. For each galaxy, the Spitzer spectrum is shown with blue points (left panel), and the NuSTAR spectra are displayed with blue and cyan points (right panels). The dashed magenta and green lines show the absorbed power law and the reprocessed components, respectively. The lower panels display the residuals between the data and the best-fit model. The data and residual errors are shown as shaded areas.
Current usage metrics show cumulative count of Article Views (full-text article views including HTML views, PDF and ePub downloads, according to the available data) and Abstracts Views on Vision4Press platform.
Data correspond to usage on the plateform after 2015. The current usage metrics is available 48-96 hours after online publication and is updated daily on week days.
Initial download of the metrics may take a while.