Fig. 2.
Download original image
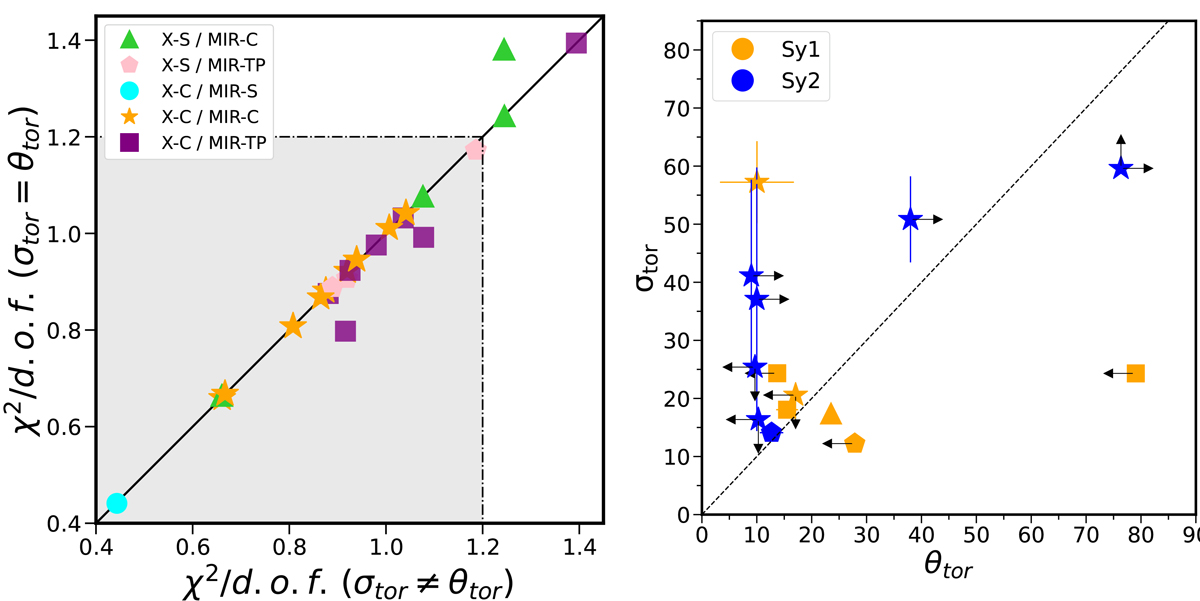
Left: Comparison between χ2/d.o.f. values before and after linking the half-opening angle from X-ray models (θtor) and torus angular width from IR models (σtor), in all sources. The shaded area shows the χ2/d.o.f. values considered as a plausible solution. The baseline models are shown with different symbols and colors: X-S/MIR-C (green triangles), X-S/MIR-TP (pink pentagons), X-C/MIR-S (cyan circles), X-C/MIR-C (orange stars), and X-C/MIR-TP (purple squares). Right: Comparison between the half-opening angle from X-ray models and torus angular width (θtor vs σtor), using baseline models where the inclination angles are linked (θinc = i). Sy1 and Sy2 are shown as orange and blue symbols. The arrows show the upper and lower limits in θtor and σtor along the axes x and y, respectively.
Current usage metrics show cumulative count of Article Views (full-text article views including HTML views, PDF and ePub downloads, according to the available data) and Abstracts Views on Vision4Press platform.
Data correspond to usage on the plateform after 2015. The current usage metrics is available 48-96 hours after online publication and is updated daily on week days.
Initial download of the metrics may take a while.