Fig. 11.
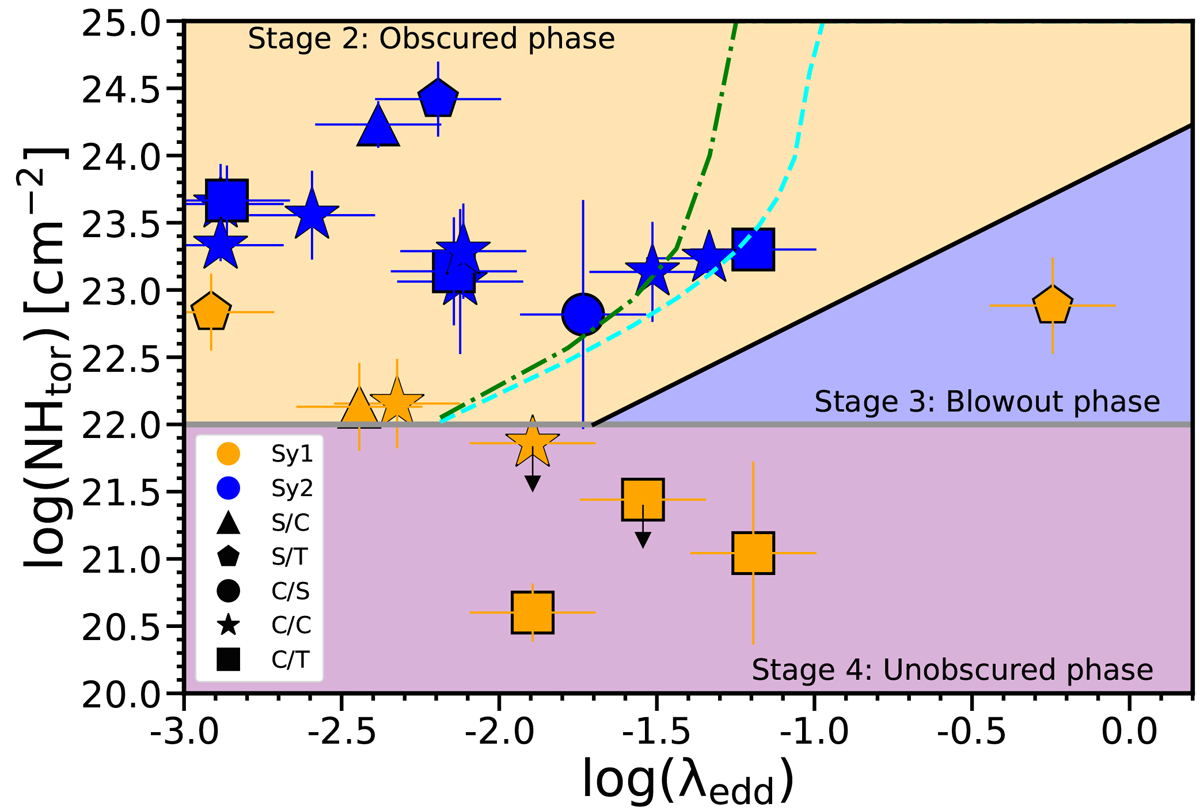
Download original image
NHtor–λEdd plane. The solid black line shows the effective Eddington limit introduced by Fabian et al. (2006). The dashed cyan and dash-dotted green lines show this limit if the radiation pressure on dust is considered, assuming one and two times the galactic dust-gas ratio, respectively. The shaded areas show the three areas that cover the different stages according to the radiation-regulated unification model proposed by Ricci et al. (2017). The solid gray line shows the limit where the NHtor could have an important contribution from the host galaxy. Symbols and colors follow the conventions used in the previous figures.
Current usage metrics show cumulative count of Article Views (full-text article views including HTML views, PDF and ePub downloads, according to the available data) and Abstracts Views on Vision4Press platform.
Data correspond to usage on the plateform after 2015. The current usage metrics is available 48-96 hours after online publication and is updated daily on week days.
Initial download of the metrics may take a while.