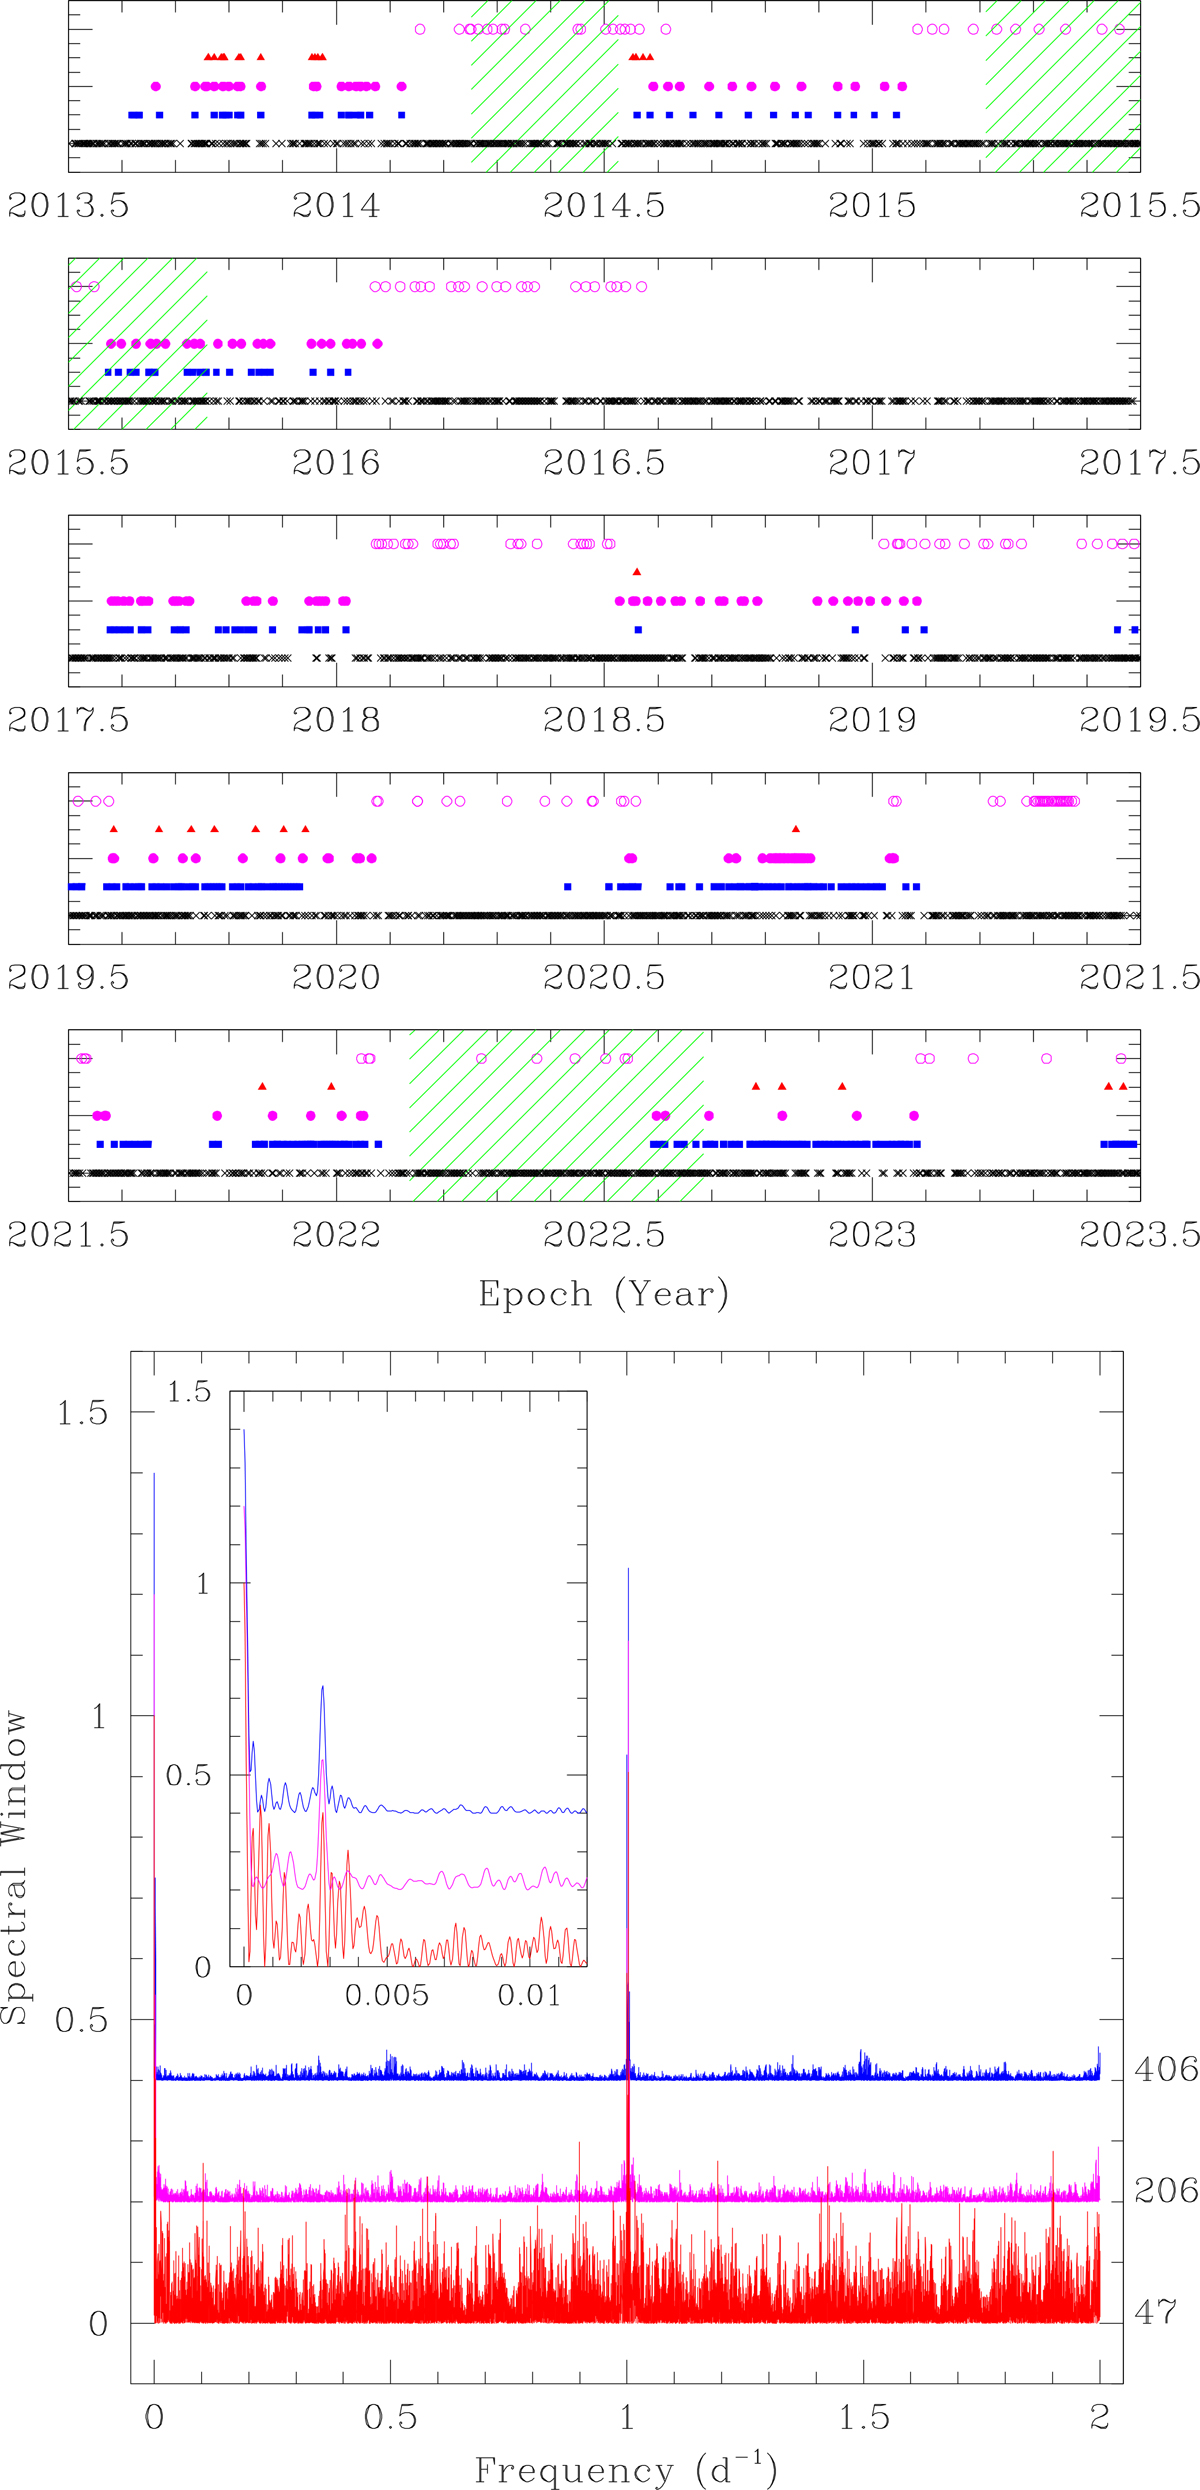
Fig. 9.
Download original image
Top: Temporal sampling of the USET data (black crosses) and the TIGRE observations of HD 10307 (blue squares), HD 17206 (magenta circles), and HD 1461 (red triangles). The latter three stars have been observed 47, 206, and 406 times, respectively, between 2013 and 2023. The hatched green areas highlight those time periods when the rotational modulation was strongest in the actual USET solar observations. Bottom: Spectral window of the time series of TIGRE observations of the same stars and using the same color code. The inset gives a zoom-in view of the low-frequency domain, illustrating the appearance of a yearly alias. The numbers on the right recall the total number of observations.
Current usage metrics show cumulative count of Article Views (full-text article views including HTML views, PDF and ePub downloads, according to the available data) and Abstracts Views on Vision4Press platform.
Data correspond to usage on the plateform after 2015. The current usage metrics is available 48-96 hours after online publication and is updated daily on week days.
Initial download of the metrics may take a while.