Fig. 7.
Download original image
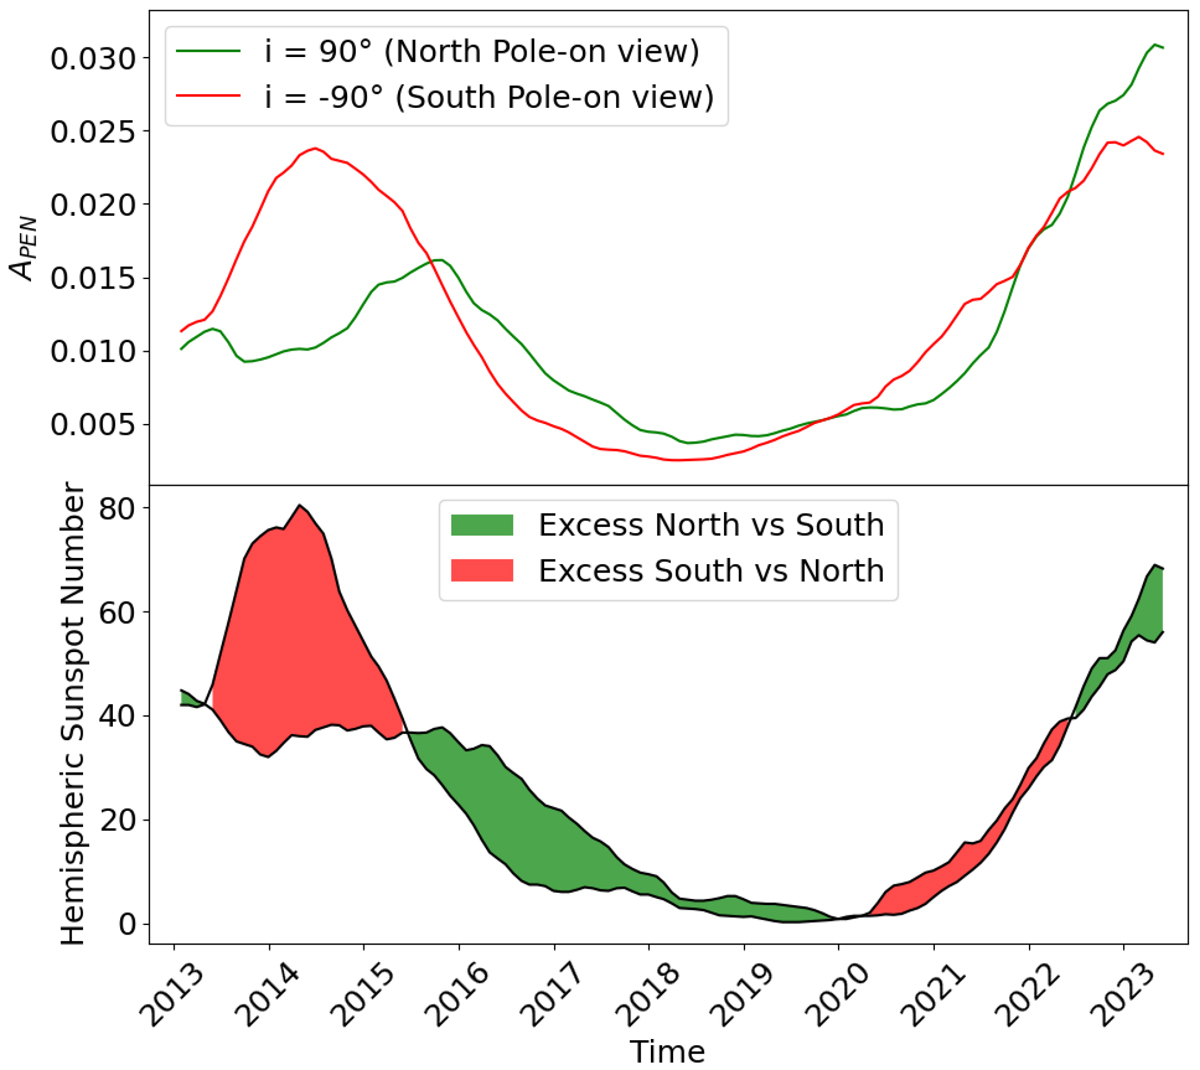
Top panel: Comparison between the area fraction of plages and enhanced network, APEN, seen from the northern hemisphere (green) and from the southern hemisphere (red). The curves are the monthly averaged data smoothed with a 13-month sliding window. Bottom panel: International Sunspot Number (ISN), hemispheric 13-month smoothed number. Green parts represent an excess of activity in the northern hemisphere while red parts represent an excess in the southern hemisphere. Credit: SILSO (Royal Observatory of Belgium).
Current usage metrics show cumulative count of Article Views (full-text article views including HTML views, PDF and ePub downloads, according to the available data) and Abstracts Views on Vision4Press platform.
Data correspond to usage on the plateform after 2015. The current usage metrics is available 48-96 hours after online publication and is updated daily on week days.
Initial download of the metrics may take a while.