Fig. 6.
Download original image
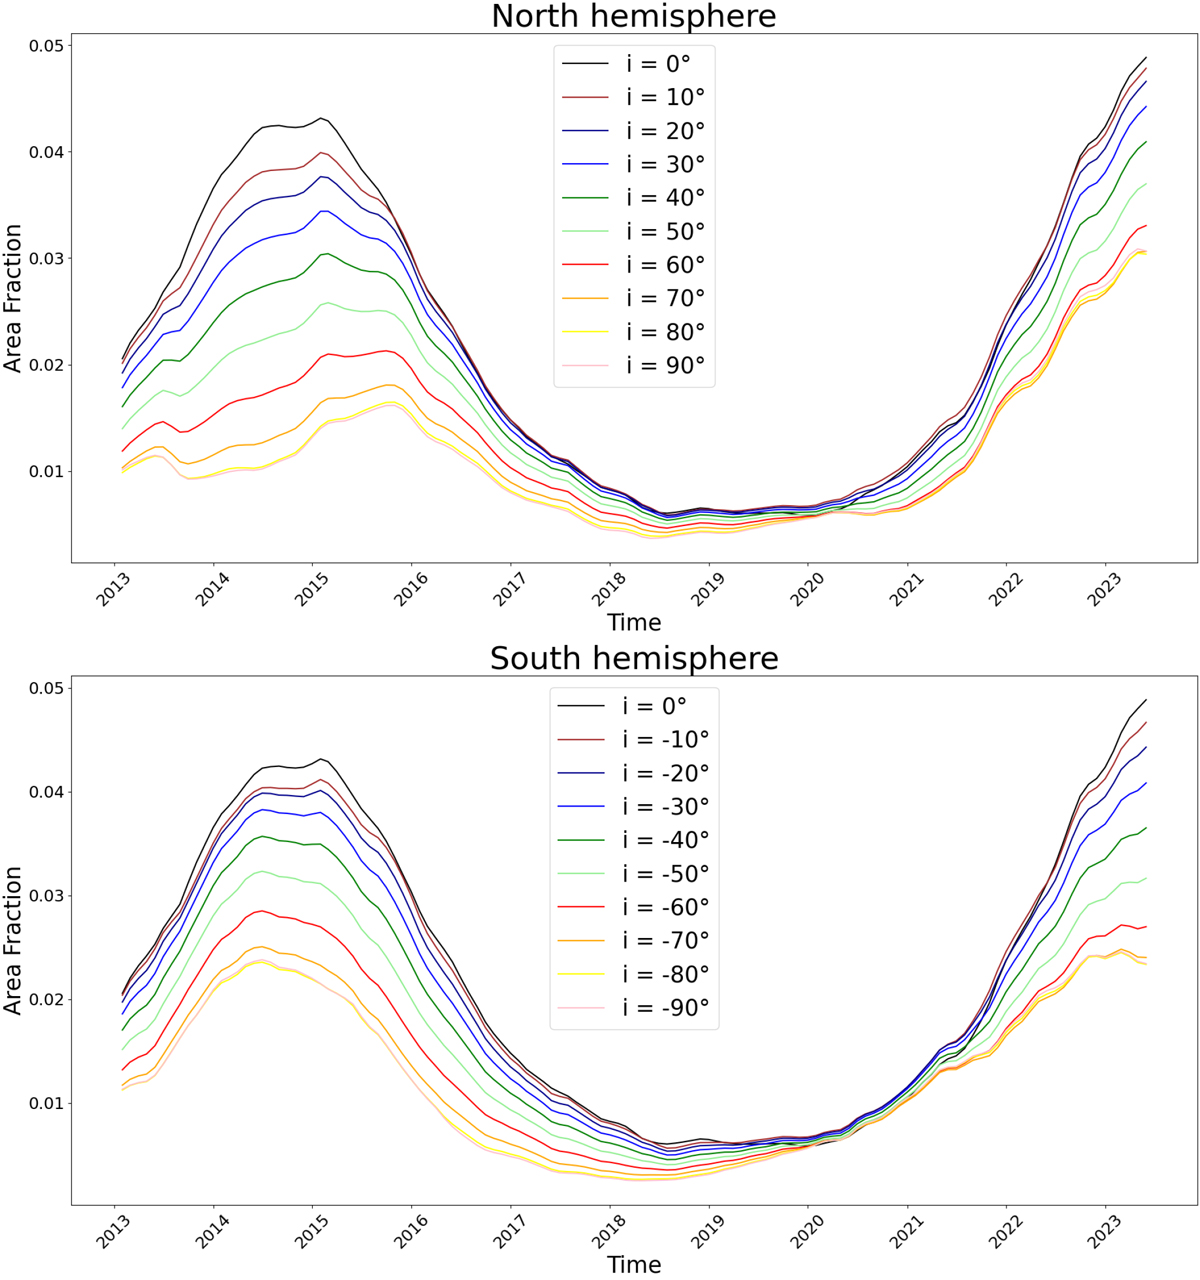
Evolution of plages and enhanced network area fraction for different inclinations. Top panel: Inclinations from the equator-on view (i = 0° of latitude) to the north pole-on view (i = 90° of latitude). Bottom panel: Inclinations from the equator-on view to the south pole-on view (i = −90° of latitude). The data are the monthly averaged data smoothed with a 13-month sliding window. The colors stand for different inclinations.
Current usage metrics show cumulative count of Article Views (full-text article views including HTML views, PDF and ePub downloads, according to the available data) and Abstracts Views on Vision4Press platform.
Data correspond to usage on the plateform after 2015. The current usage metrics is available 48-96 hours after online publication and is updated daily on week days.
Initial download of the metrics may take a while.