Open Access
Fig. 4.
Download original image
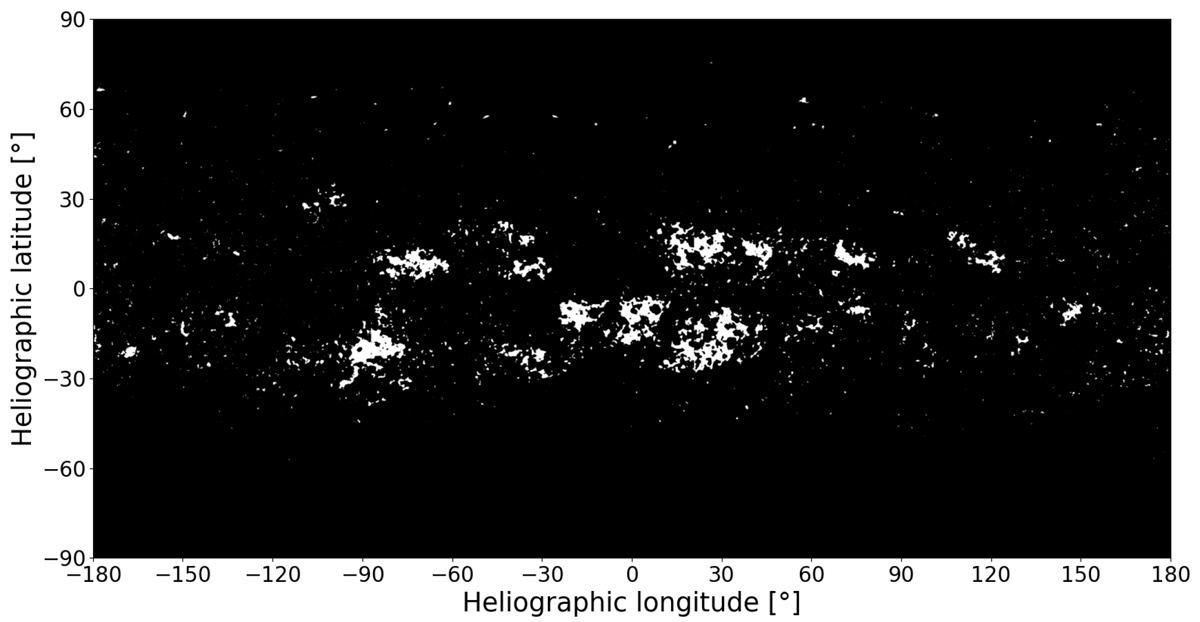
Example of a segmented synoptic map built around July 7, 2014, illustrating the distribution of the plages and enhanced network during a full solar rotation. The x-axis represents the number of degrees of longitude from the Carrington longitude on July 7, 2014 (center of image).
Current usage metrics show cumulative count of Article Views (full-text article views including HTML views, PDF and ePub downloads, according to the available data) and Abstracts Views on Vision4Press platform.
Data correspond to usage on the plateform after 2015. The current usage metrics is available 48-96 hours after online publication and is updated daily on week days.
Initial download of the metrics may take a while.