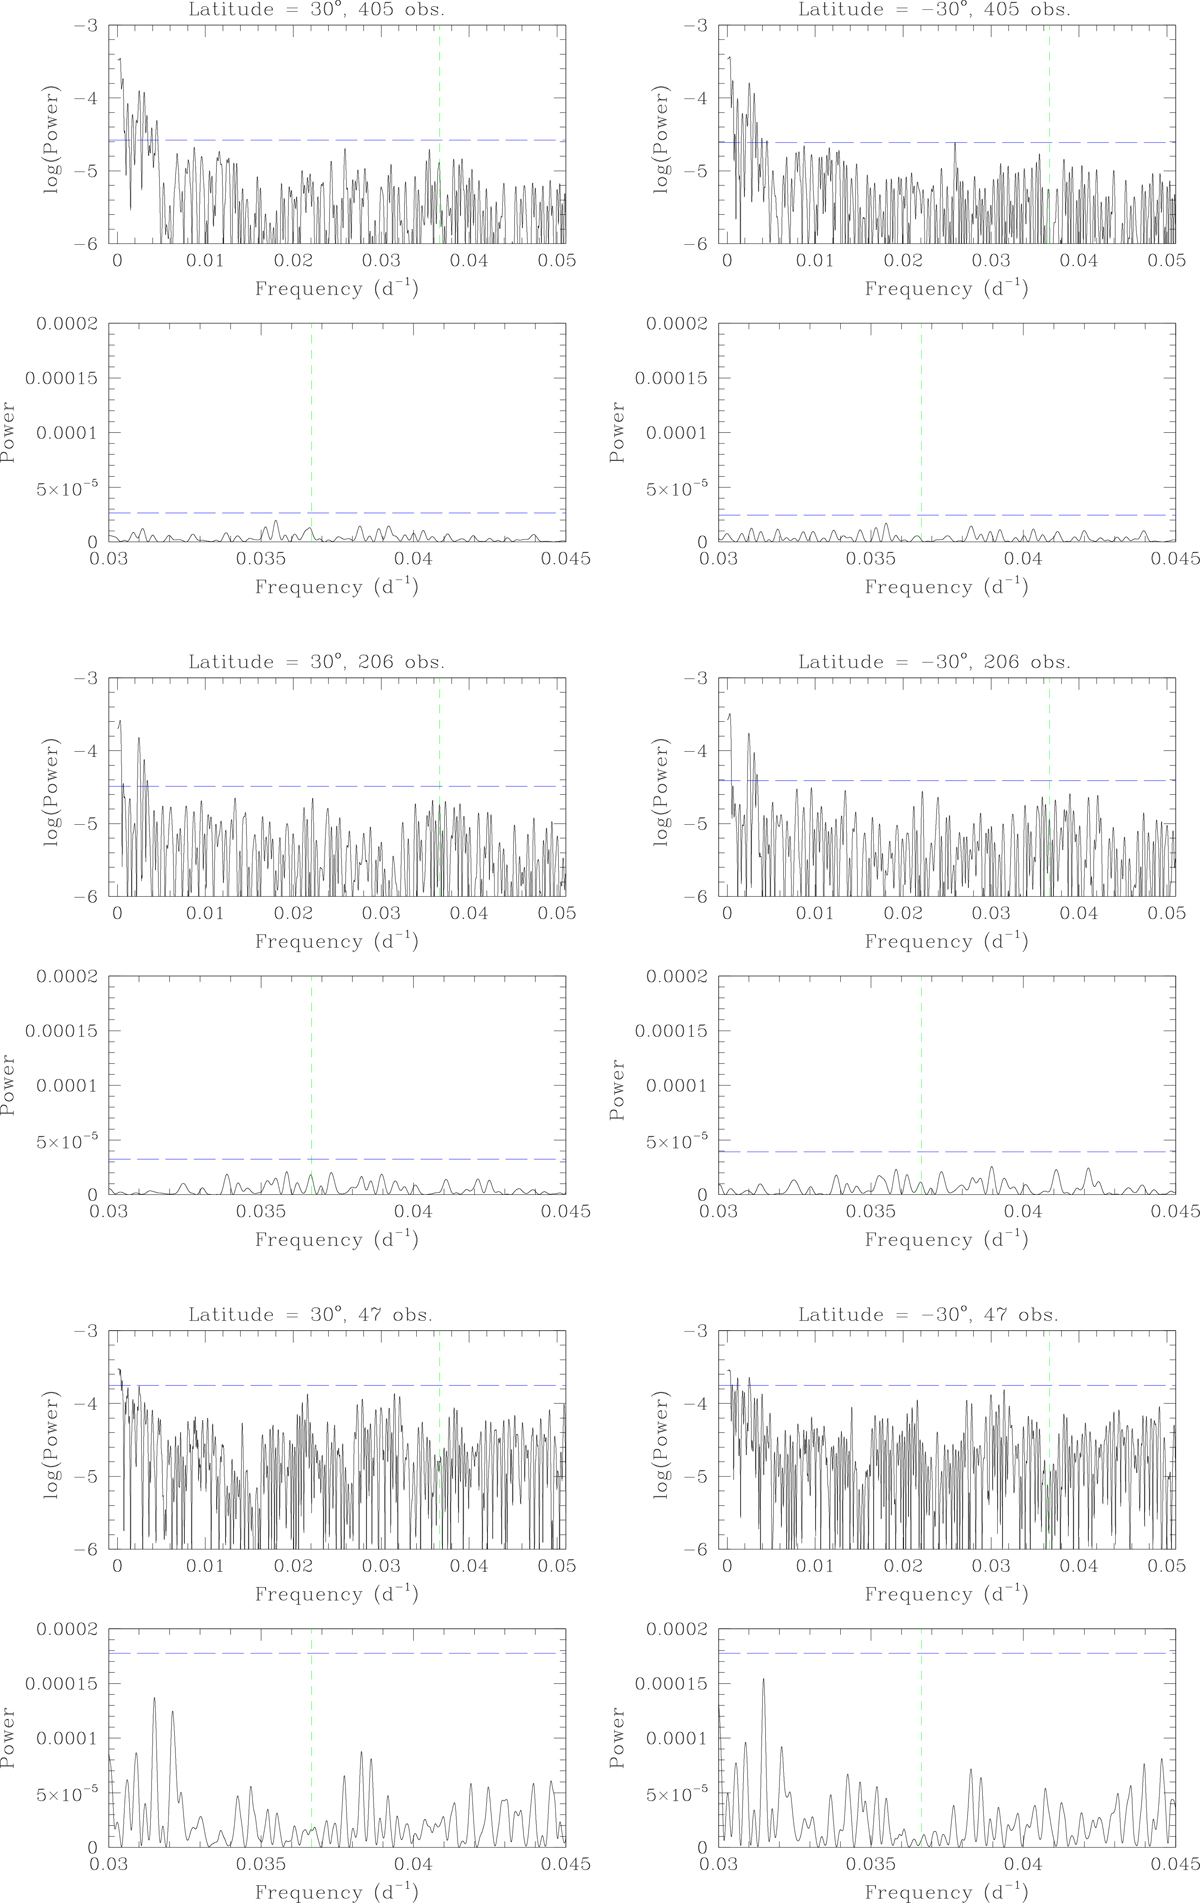
Fig. D.1.
Download original image
Fourier power spectrum of the resampled USET time series for a decreasing observing cadence (from top to bottom) and for inclination angles of +30° (left column) and −30° (right column row). For each case, the top panel illustrates the logarithm of the power spectrum for frequencies below 0.05 d−1 and the bottom panel provides a zoom-in on the power around νCar (given by the short-dashed green vertical line). The long-dashed blue horizontal line yields the 99% significance level.
Current usage metrics show cumulative count of Article Views (full-text article views including HTML views, PDF and ePub downloads, according to the available data) and Abstracts Views on Vision4Press platform.
Data correspond to usage on the plateform after 2015. The current usage metrics is available 48-96 hours after online publication and is updated daily on week days.
Initial download of the metrics may take a while.