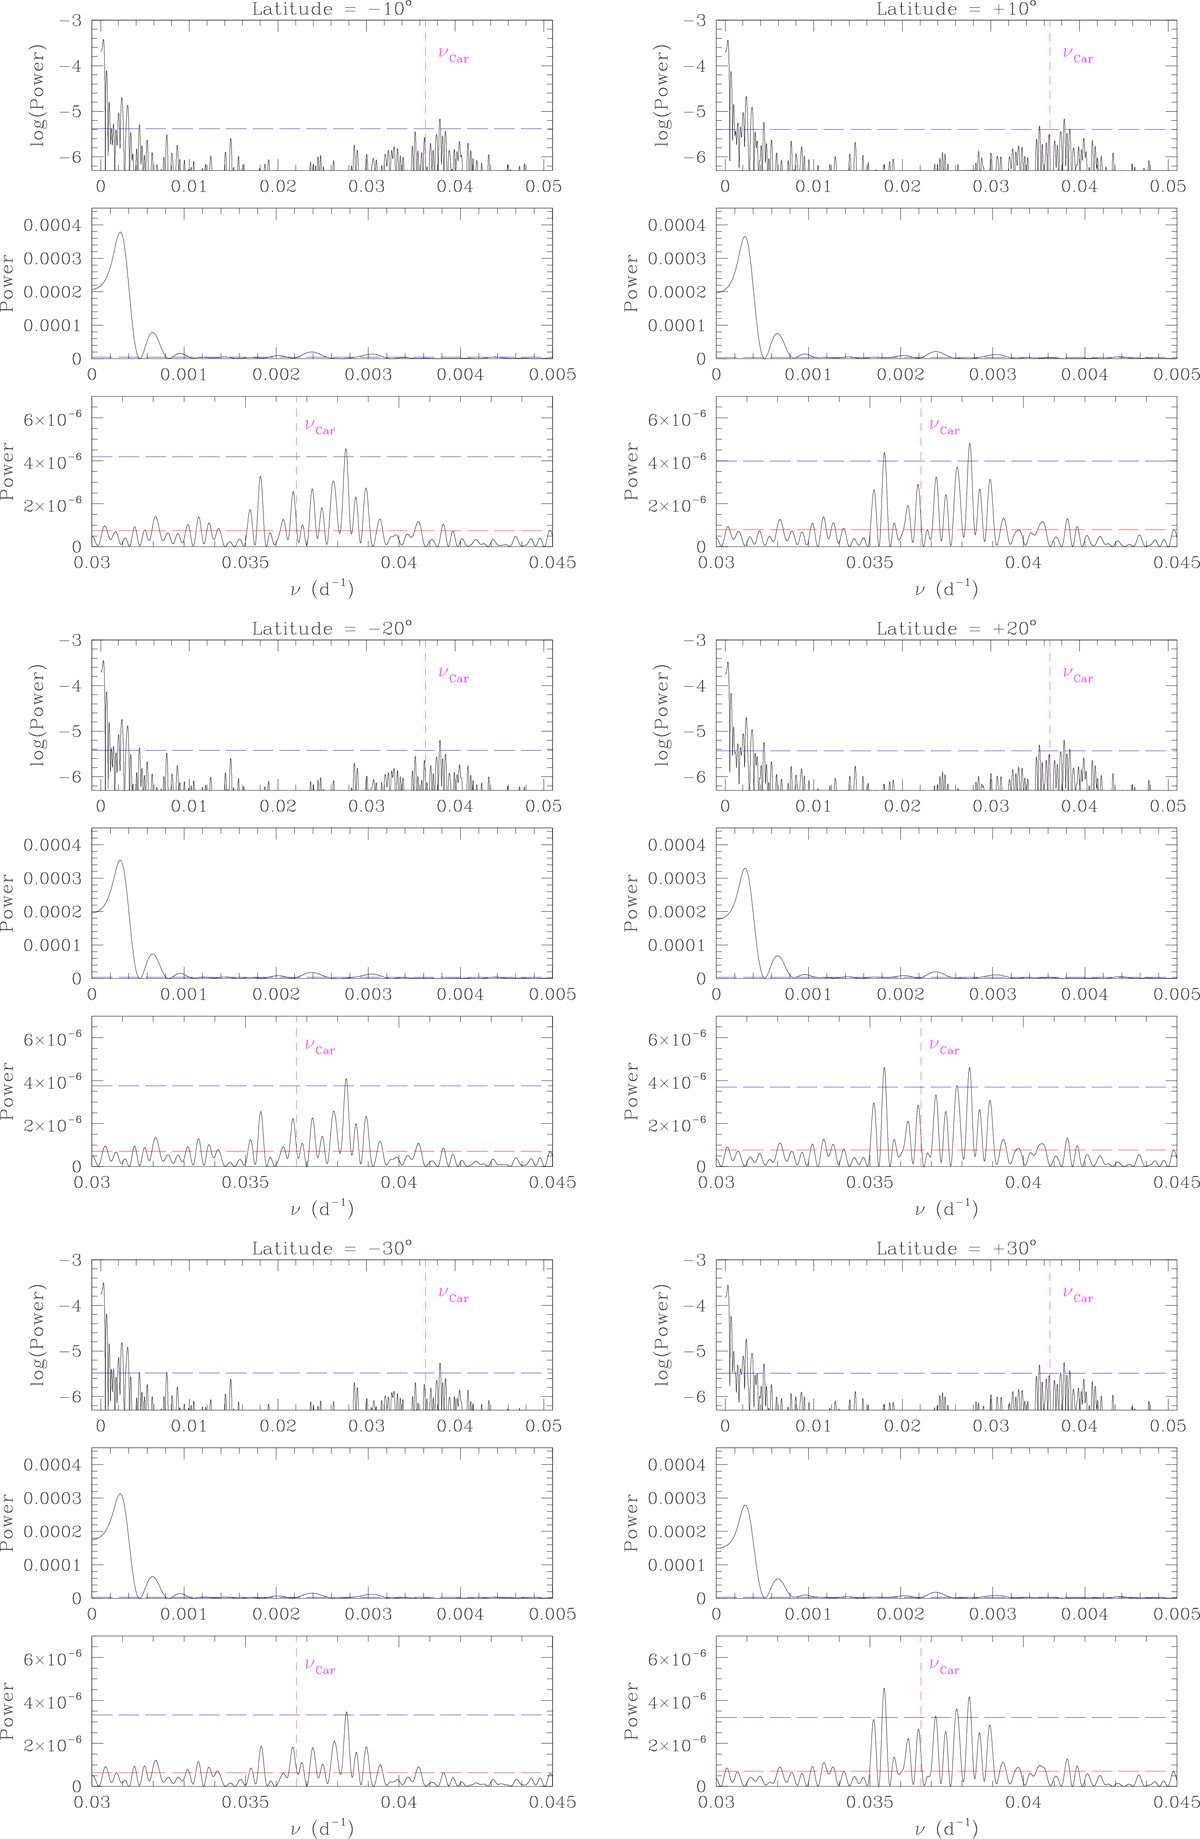
Fig. B.1.
Download original image
Same as Fig. 8, but for inclinations of −90° to 90°. The upper and middle panels correspond to the power spectrum of the original data, whilst the lower panel yields the power spectrum of the time series detrended for the long-term cycle. The blue dashed lines in each panel illustrate the 99% significance level for the original time series, whilst the red dashed line in the bottom panel corresponds to the 99% significance level of the detrended time series. The magenta vertical lines in the top and bottom panel indicate the Carrington rotation frequency.
Current usage metrics show cumulative count of Article Views (full-text article views including HTML views, PDF and ePub downloads, according to the available data) and Abstracts Views on Vision4Press platform.
Data correspond to usage on the plateform after 2015. The current usage metrics is available 48-96 hours after online publication and is updated daily on week days.
Initial download of the metrics may take a while.