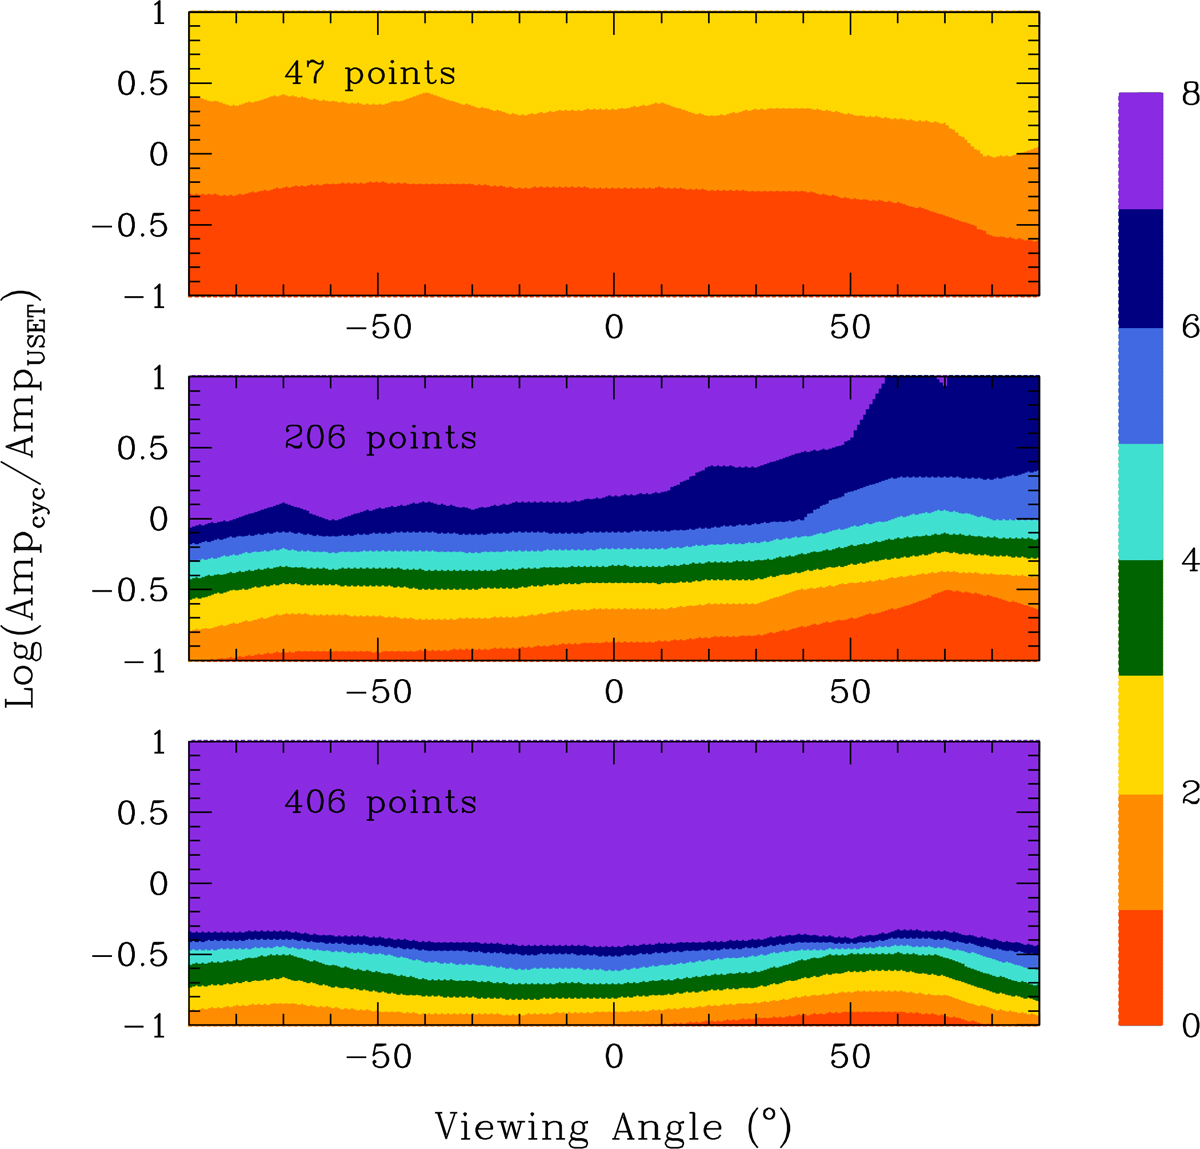
Fig. 11.

Download original image
Detectability of the long-term cycle as a function of the viewing angle and the scaled amplitude of the long-term cycle. The different panels correspond to different samplings, with the number of data points taken over 10 years indicated in each panel. The color scale to the right indicates the ratio between the power of the peak associated with the long-term cycle in the Fourier power spectrum and the power corresponding to the 99% significance level.
Current usage metrics show cumulative count of Article Views (full-text article views including HTML views, PDF and ePub downloads, according to the available data) and Abstracts Views on Vision4Press platform.
Data correspond to usage on the plateform after 2015. The current usage metrics is available 48-96 hours after online publication and is updated daily on week days.
Initial download of the metrics may take a while.


