Fig. 10.
Download original image
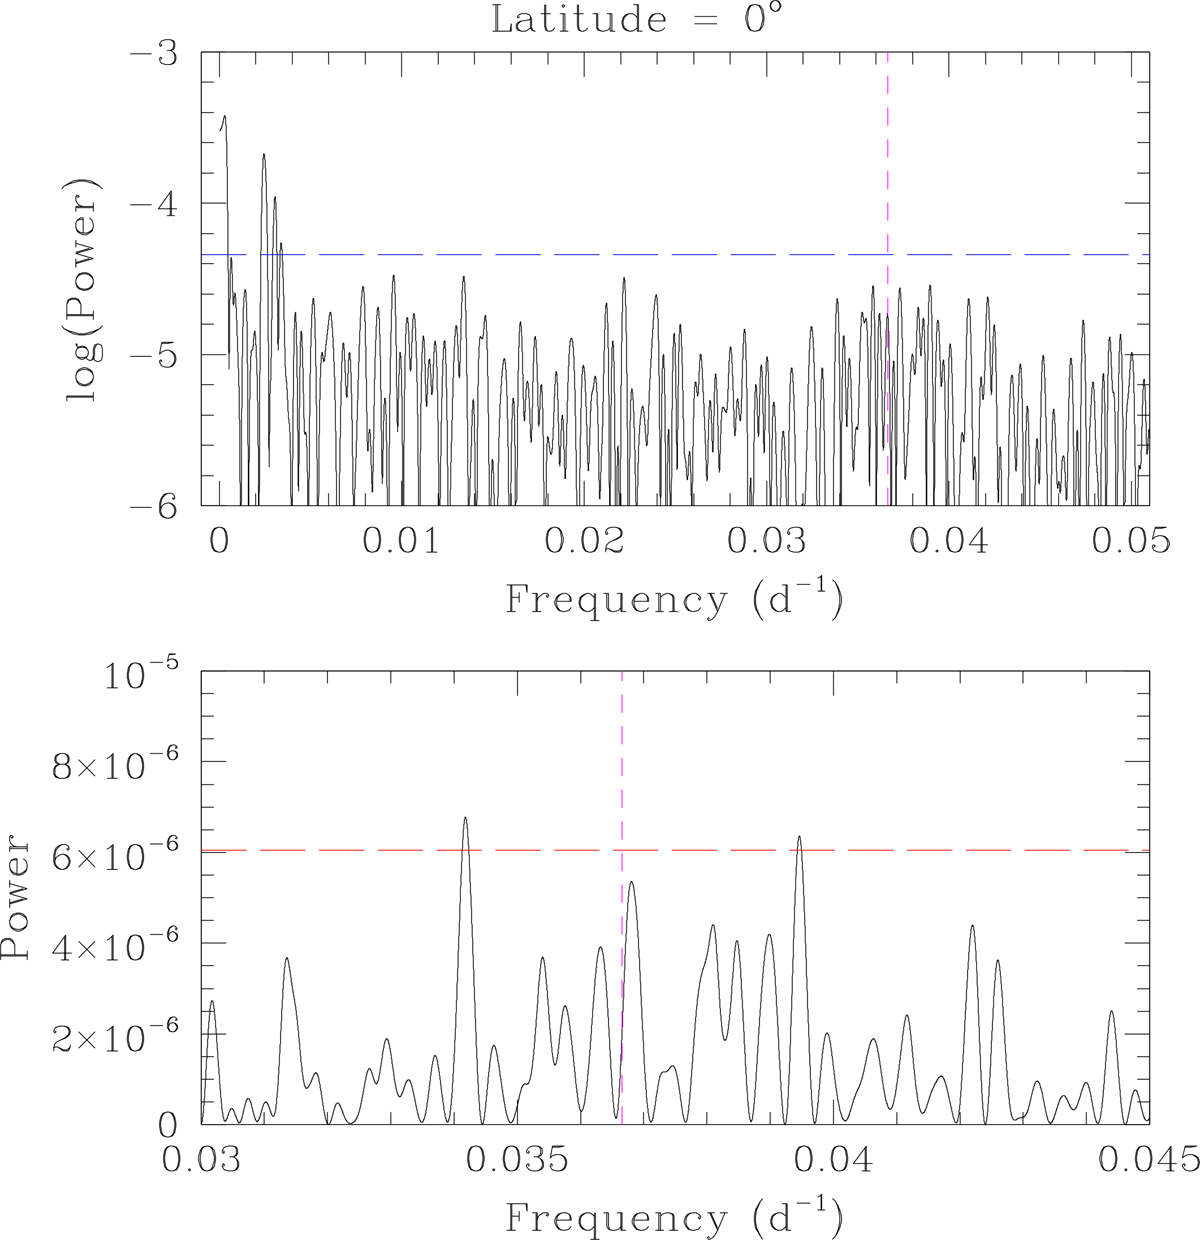
Fourier power spectrum of the resampled USET time series, assuming 206 observations spread over 10 years for an equator-on view. The top panel illustrates the logarithm of the power spectrum for frequencies below 0.05 d−1. The long-dashed blue line marks the 99% significance level. The bottom panel provides a zoom-in on the power spectrum around νCar (given by the short-dashed magenta vertical line) after removing the long-term trend from the data. The long-dashed red line indicates the 99% significance level for the detrended time series. The magenta vertical lines in the top and bottom panels indicate the Carrington rotation frequency.
Current usage metrics show cumulative count of Article Views (full-text article views including HTML views, PDF and ePub downloads, according to the available data) and Abstracts Views on Vision4Press platform.
Data correspond to usage on the plateform after 2015. The current usage metrics is available 48-96 hours after online publication and is updated daily on week days.
Initial download of the metrics may take a while.