Fig. 2.
Download original image
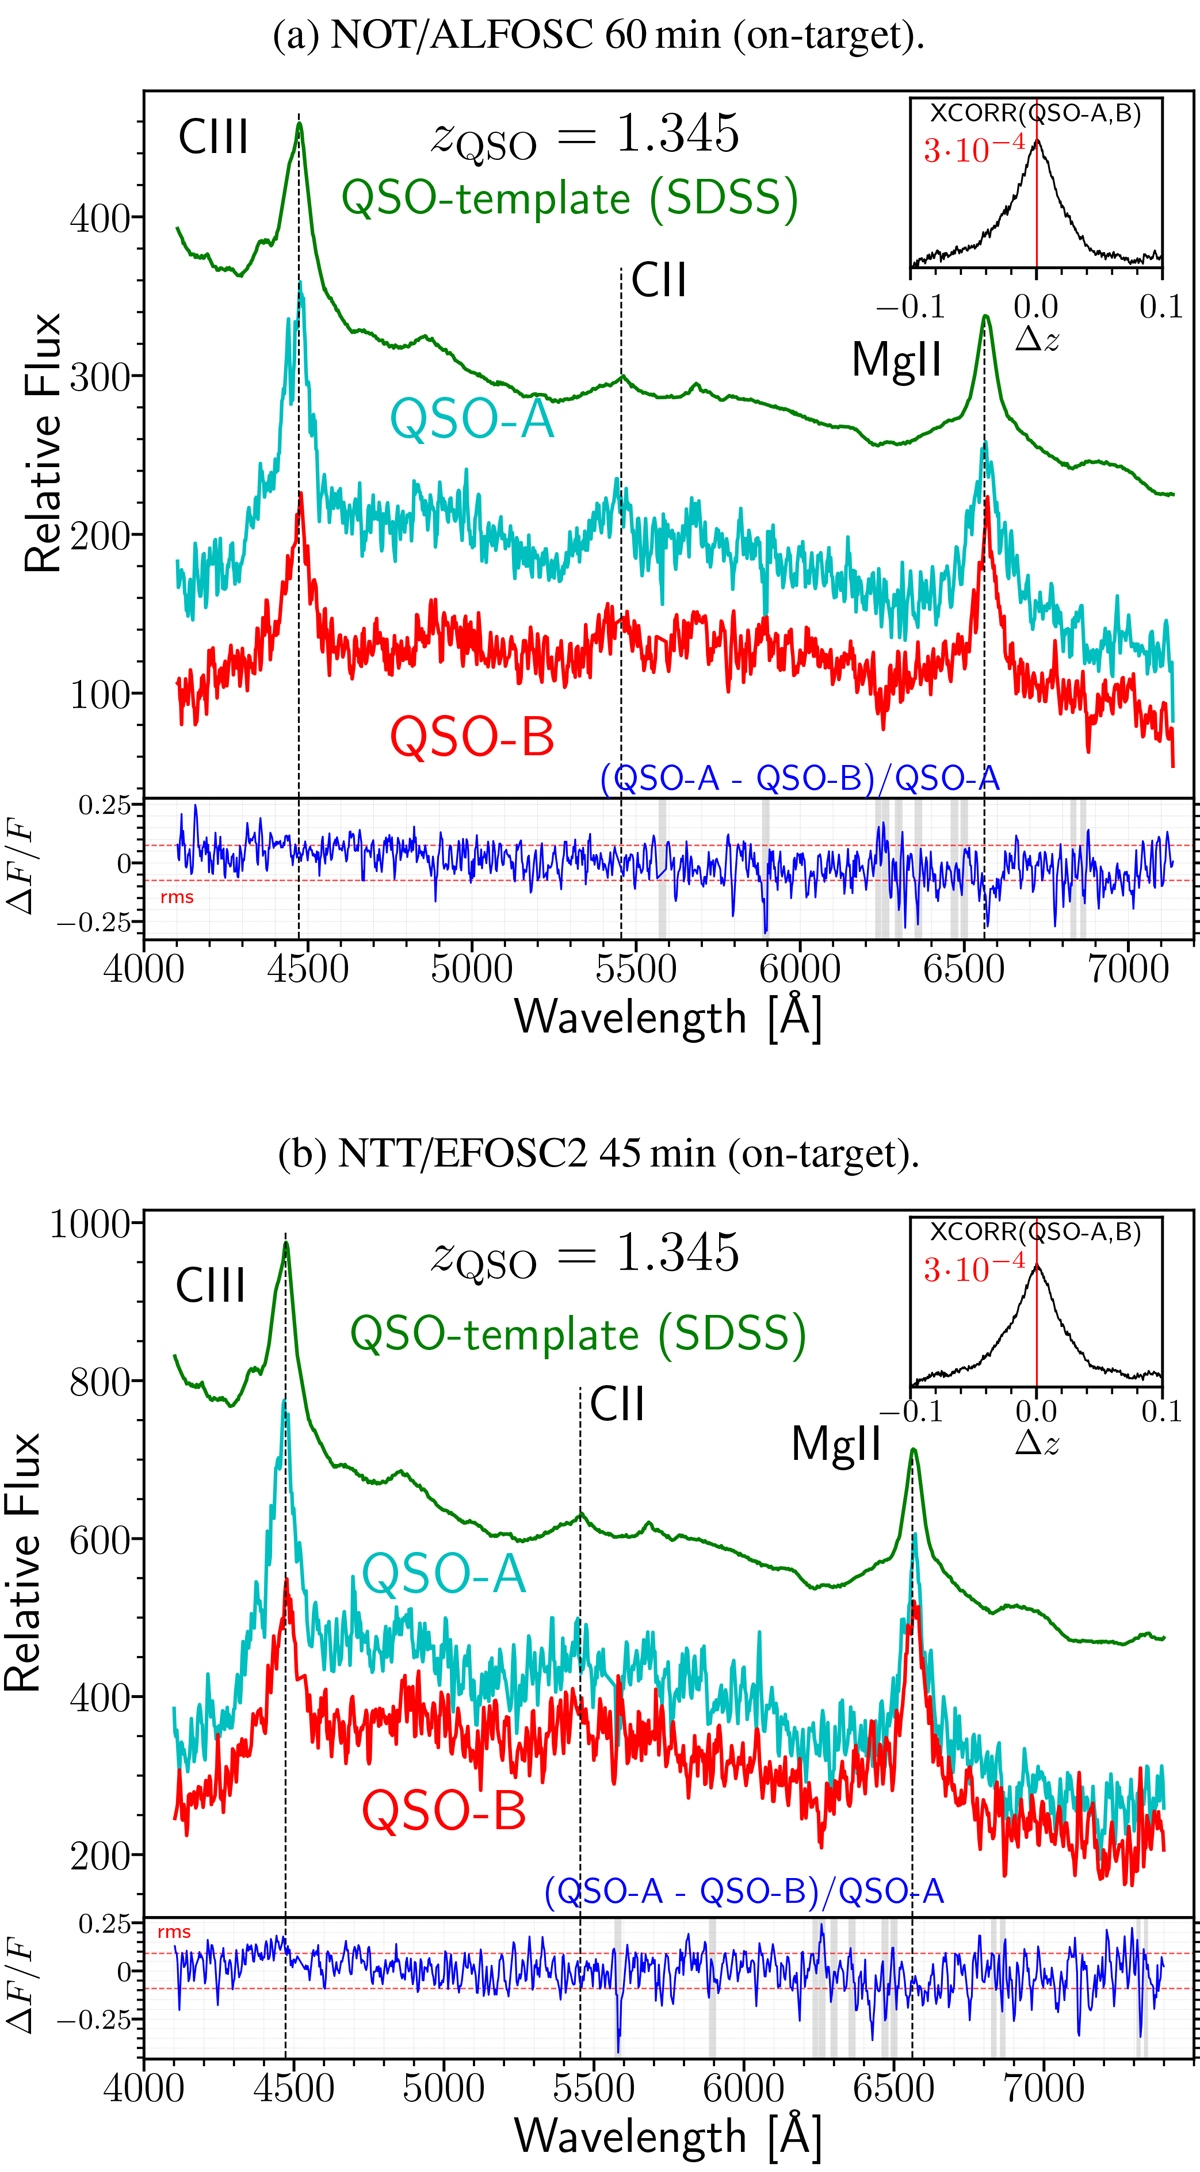
Spectra of the two lensed QSO candidates (A and B, respectively in cyan and red) from NOT/ALFOSC (top) and NTT/EFOSC2 (bottom). The green curve is an SDSS QSO spectrum template. The vertical dotted lines (4475.97 Å, 5454.47 Å, and 6563.07 Å) represent the positions of emission lines of the corresponding ions redshifted to zQSO, spec = 1.345 of CIII] (1908.73 Å), CII] (2326 Å), and MgII (2798.75 Å), respectively. The two top-right insets show the cross-correlations of the QSO-A and QSO-B spectra. The bottom panel in each plot (blue line) shows the mean-subtracted relative flux difference of QSO-A with respect to QSO-B, the dashed red lines representing its rms. The grey bands highlight spectral regions with prominent sky emission lines, corresponding to significant residuals in the sky subtraction.
Current usage metrics show cumulative count of Article Views (full-text article views including HTML views, PDF and ePub downloads, according to the available data) and Abstracts Views on Vision4Press platform.
Data correspond to usage on the plateform after 2015. The current usage metrics is available 48-96 hours after online publication and is updated daily on week days.
Initial download of the metrics may take a while.