Open Access
Fig. A.1.
Download original image
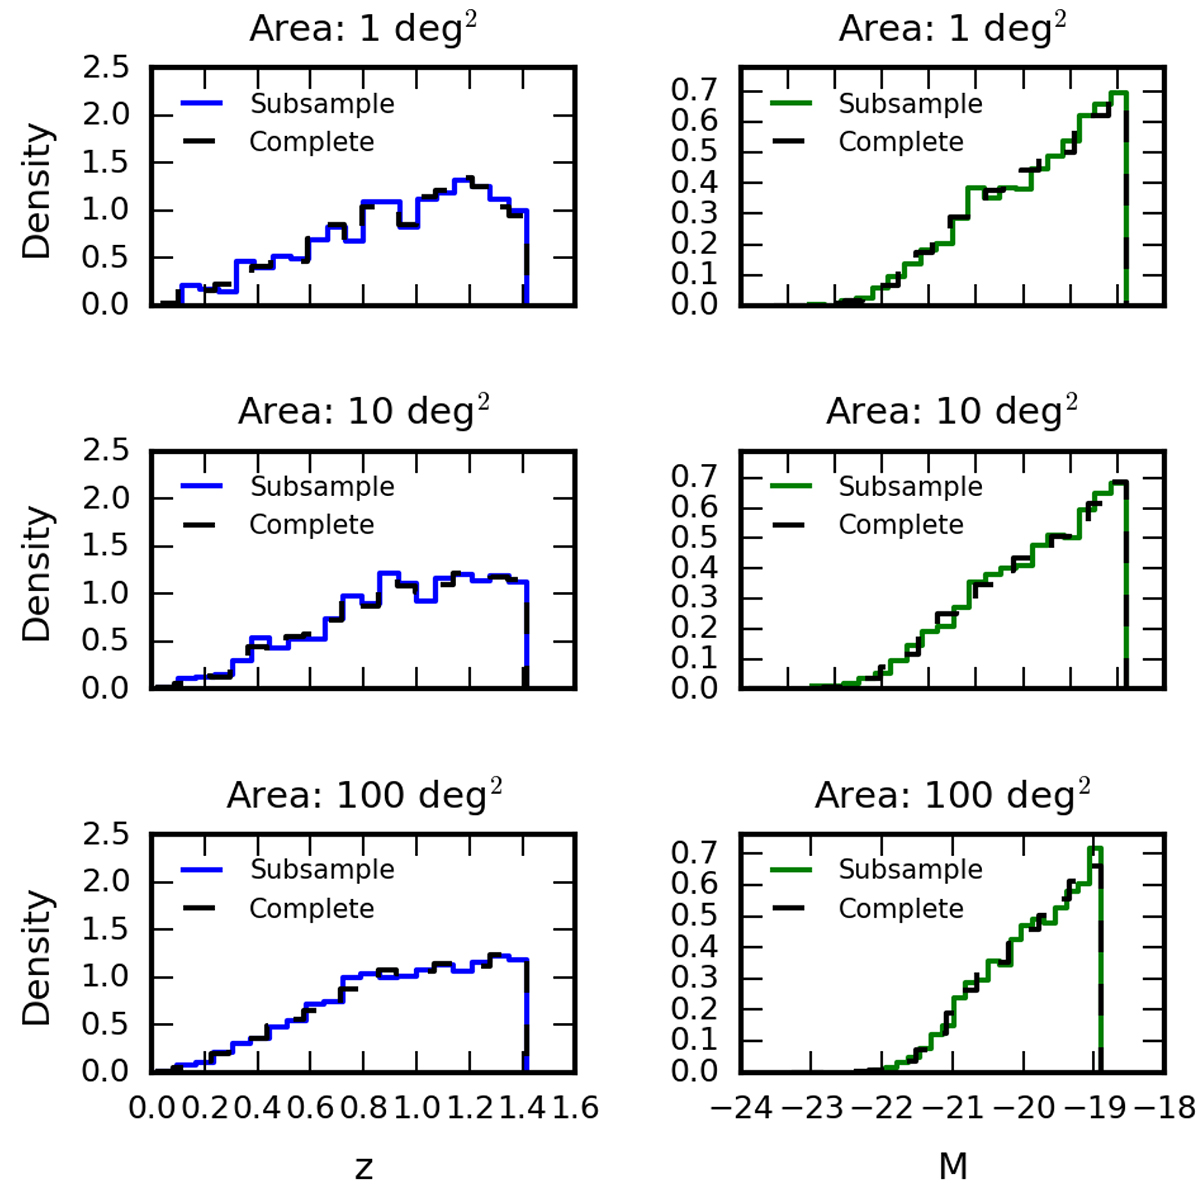
Comparison of the distribution of redshifts (left column) and magnitudes (right column) between original galaxies for some selected LOSs in MICEcat and the sub-sampled ones. The rows report sky areas of respectively 1 deg2, 10 deg2, and 100 deg2.
Current usage metrics show cumulative count of Article Views (full-text article views including HTML views, PDF and ePub downloads, according to the available data) and Abstracts Views on Vision4Press platform.
Data correspond to usage on the plateform after 2015. The current usage metrics is available 48-96 hours after online publication and is updated daily on week days.
Initial download of the metrics may take a while.