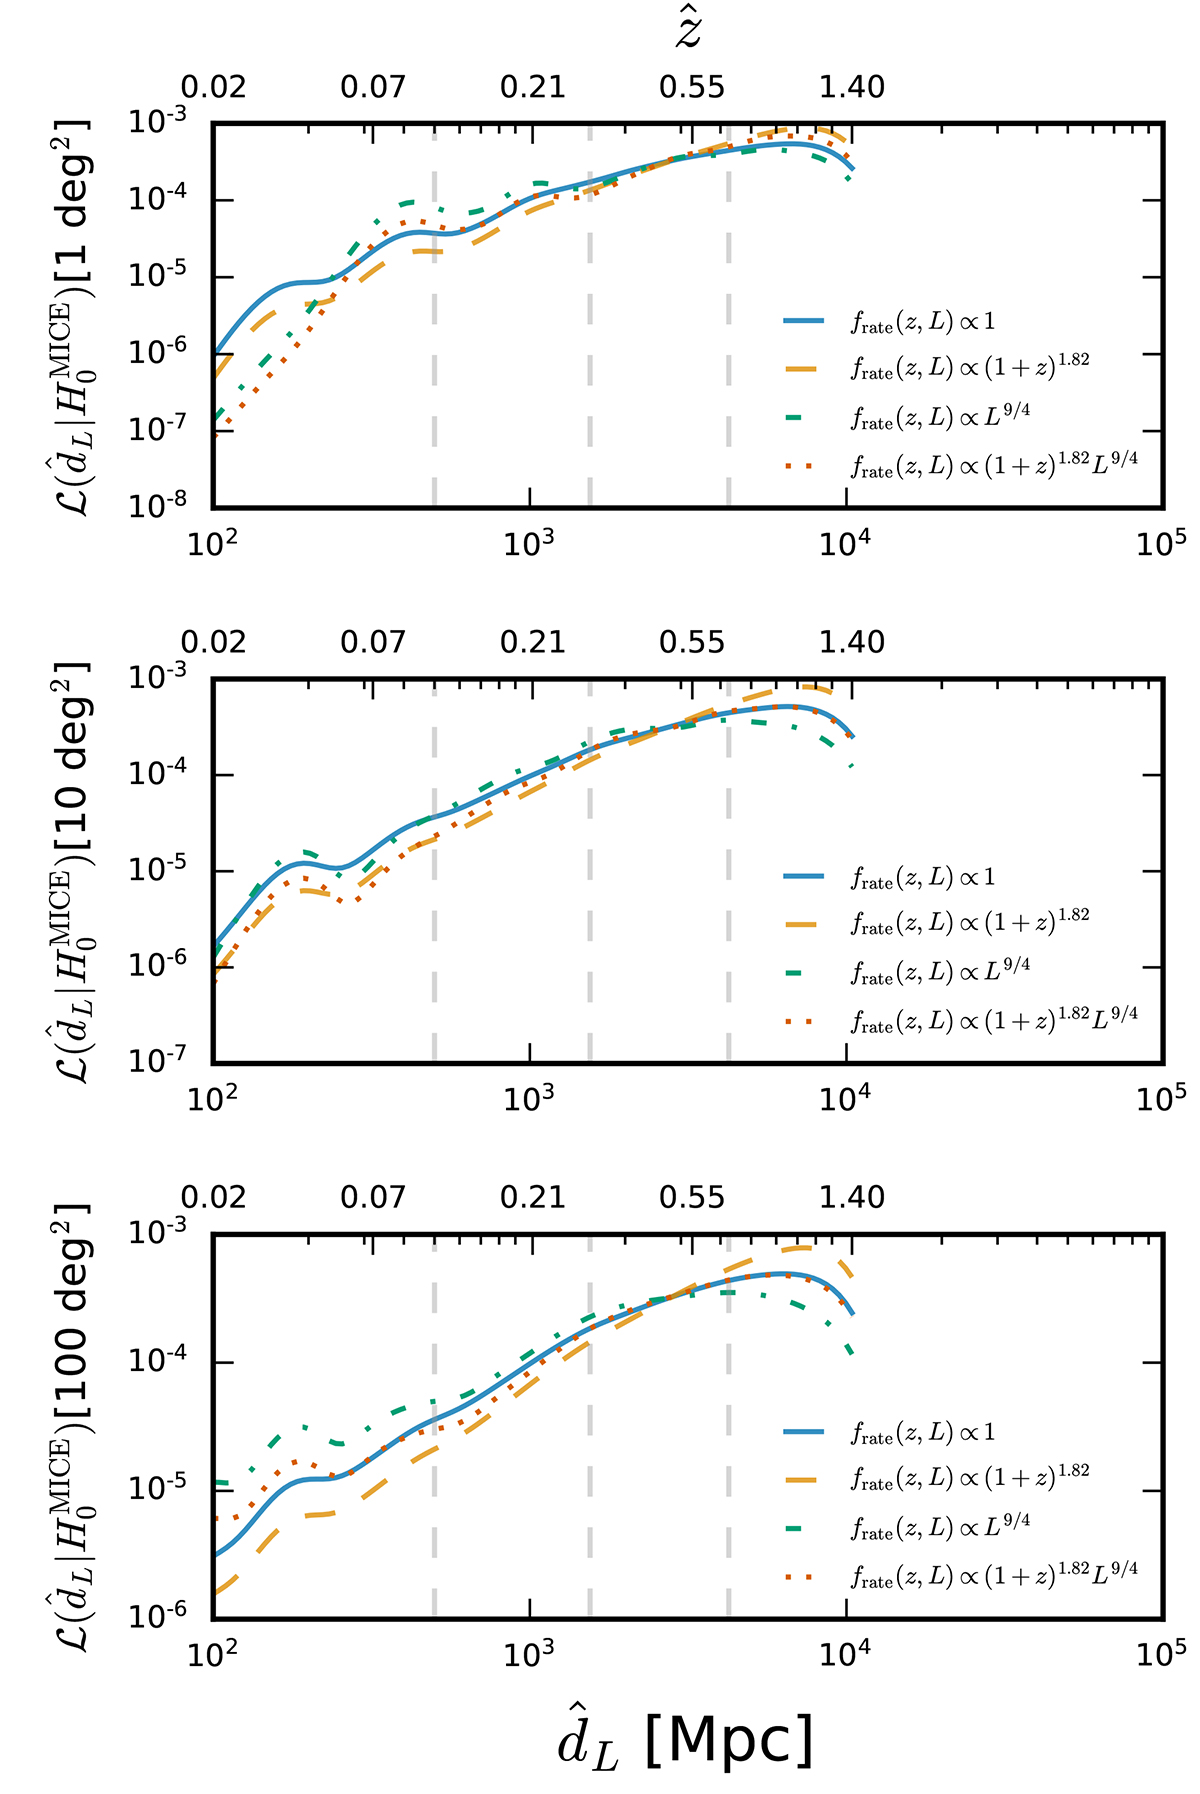
Fig. 4.
Download original image
Single-likelihood estimator (vertical axis; see Eq. (18)) as a function of the observed luminosity distance (horizontal axis). The top, middle, and bottom panels were generated assuming that the GW event is localized in a 1 deg2, 10 deg2, and 100 deg2 sky area. The different lines were generated assuming the four prescriptions of frate used in this work and assuming ![]() = 500 Mpc (we note that such a choice just acts as an overall normalization constant).
= 500 Mpc (we note that such a choice just acts as an overall normalization constant).
Current usage metrics show cumulative count of Article Views (full-text article views including HTML views, PDF and ePub downloads, according to the available data) and Abstracts Views on Vision4Press platform.
Data correspond to usage on the plateform after 2015. The current usage metrics is available 48-96 hours after online publication and is updated daily on week days.
Initial download of the metrics may take a while.