Fig. 8.
Download original image
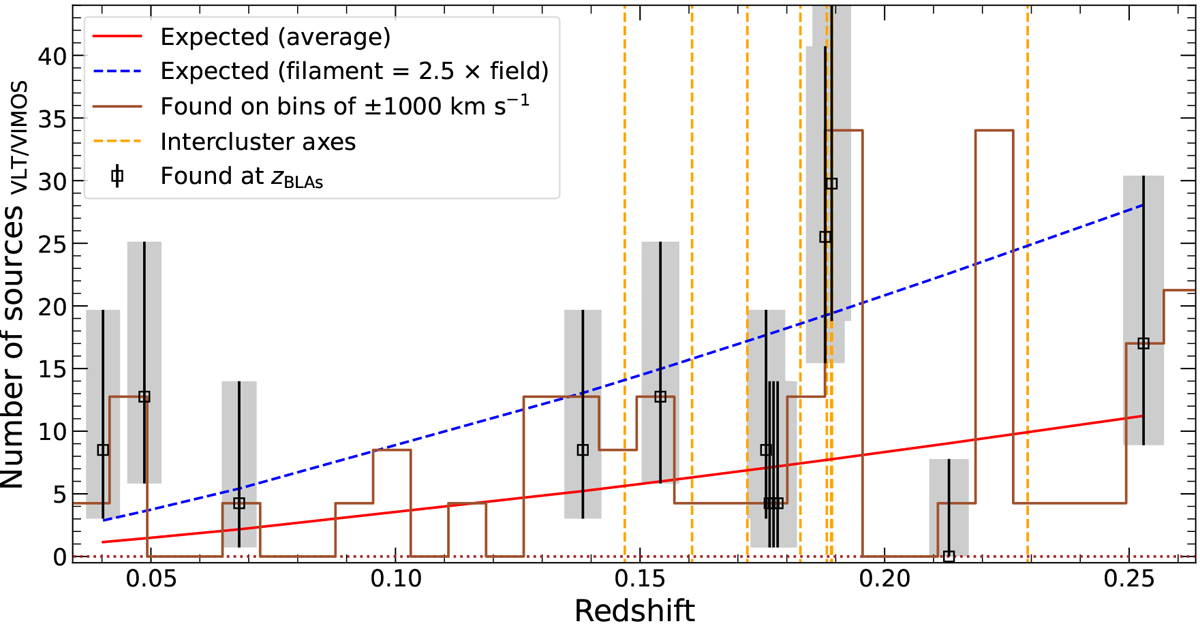
Comparison between the number of galaxies randomly expected at the redshift of the BLAs reported in Section 2.7, within a velocity window of ±1000 km s−1, inside the physical area enclosed by the total VLT/VIMOS FoV at a given redshfit, with the number of galaxies actually ‘found’ at that redshift range (corrected by the completeness effects described in Section 2.6.4). The black squares represent this corrected number of detected galaxies with their respective Poissonian uncertainty at the redshift of the BLAs (reliability “a” or “b”, see Sect. 2.7). The Poissonian error bars have been calculated following Gehrels (1986). The width of the gray area marks the ±1000 km s−1 region around the BLAs. The solid brown line shows the completeness-corrected number of galaxies found in bins of ±1000 km s−1, regardless of the presence of a BLA. The dotted brown line shows the zero level. The red line represents the randomly expected number of galaxies and the dashed blue line represents the number of galaxies expected in an environment 2.5 times denser, such as the filaments. At the redshift of 4 of the BLAs (≈0.04021, ≈0.04866, ≈0.18787, ≈0.18919), we find a clear excess of galaxies, consistent with an overdense region. The vertical dashed orange lines mark the redshift at which we find a galaxy cluster pair whose intercluster axis passes near the LoS of the QSO (see Sect. 2.2).
Current usage metrics show cumulative count of Article Views (full-text article views including HTML views, PDF and ePub downloads, according to the available data) and Abstracts Views on Vision4Press platform.
Data correspond to usage on the plateform after 2015. The current usage metrics is available 48-96 hours after online publication and is updated daily on week days.
Initial download of the metrics may take a while.