Fig. 7.
Download original image
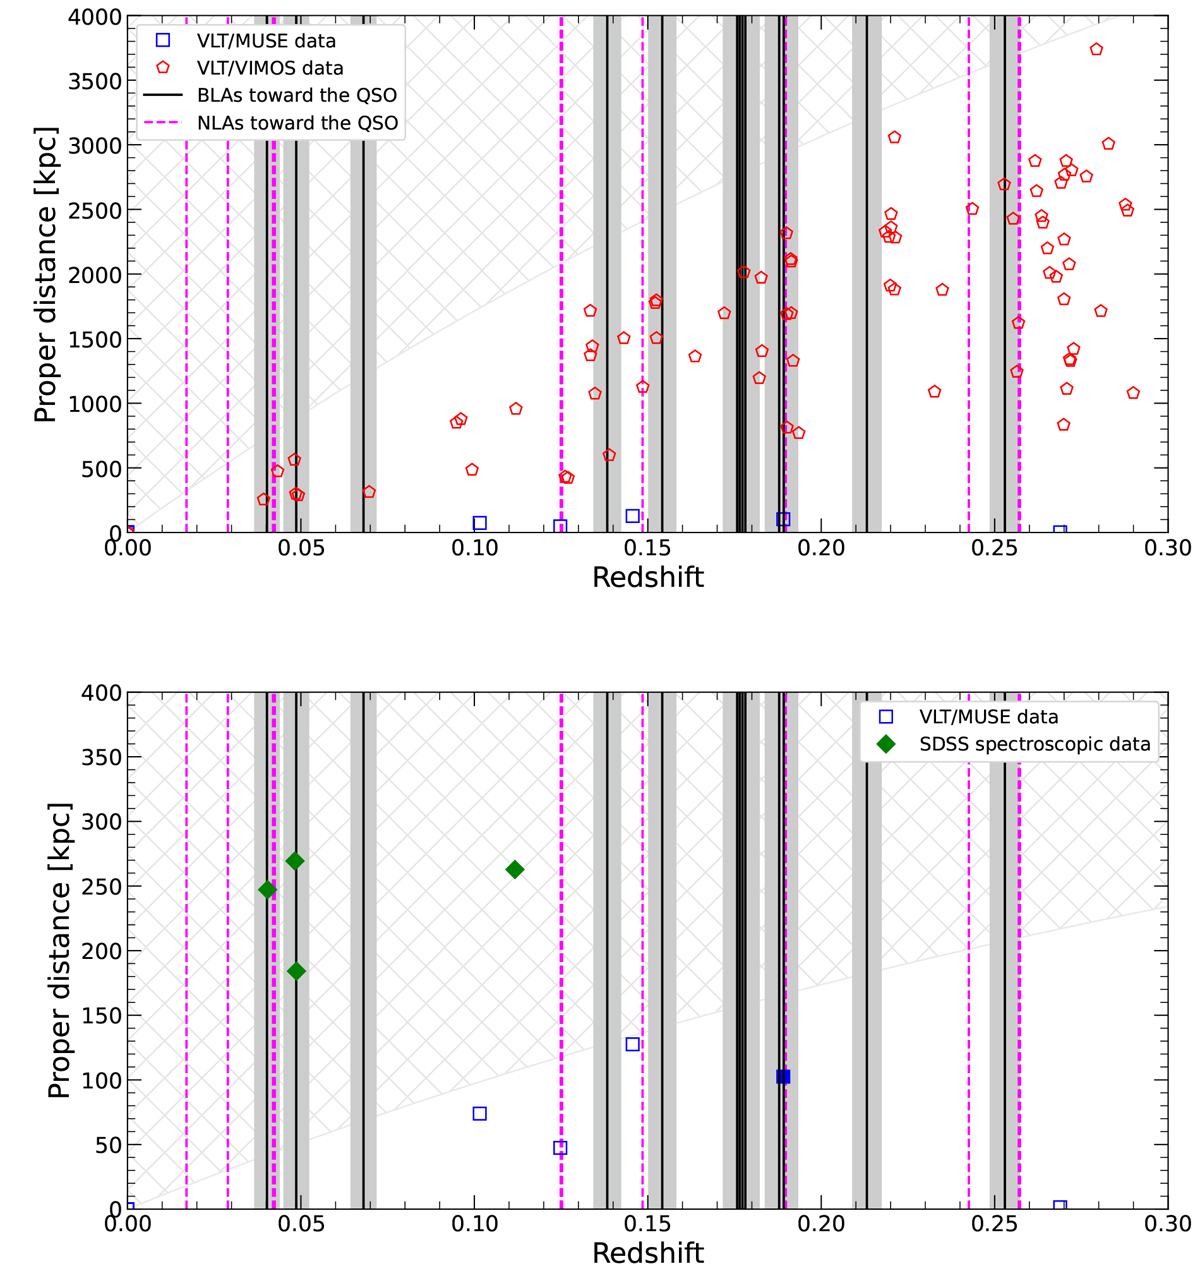
Impact parameter to the QSO sightline as a function of the redshift of each source in our survey. Top: Sources up to a projected distance of 4 Mpc from the QSO sightline. Objects in our VLT/MUSE and VLT/VIMOS surveys are represented with blue squares and red pentagons, respectively. The vertical solid black lines and their background gray area mark the redshifts of the reported BLAs ±1000 km s−1. The hatched area shows a 15 arcminute distance from the central QSO, which would correspond to approximately the edges of the VLT/VIMOS FoV at a given redshift. The vertical dashed magenta lines indicate the redshift of the NLAs detected in the spectrum of the QSO. Bottom: Sources closer to the QSO sightlines in our VLT/MUSE survey, at impact parameters up to ∼150 kpc (blue squares). The filled blue square represents a galaxy found to be very close in velocity (within ±1000 km s−1) to the BLAs at z ≈ 0.18787 and z ≈ 0.18919. The hatched area shows the approximate edges of the VLT/MUSE FoV. Additionally, we include data from the SDSS DR16 (green diamonds), in order to look for nearby galaxies that we could be missing due to our lack of impact parameter coverage at low redshift.
Current usage metrics show cumulative count of Article Views (full-text article views including HTML views, PDF and ePub downloads, according to the available data) and Abstracts Views on Vision4Press platform.
Data correspond to usage on the plateform after 2015. The current usage metrics is available 48-96 hours after online publication and is updated daily on week days.
Initial download of the metrics may take a while.