Fig. 6.
Download original image
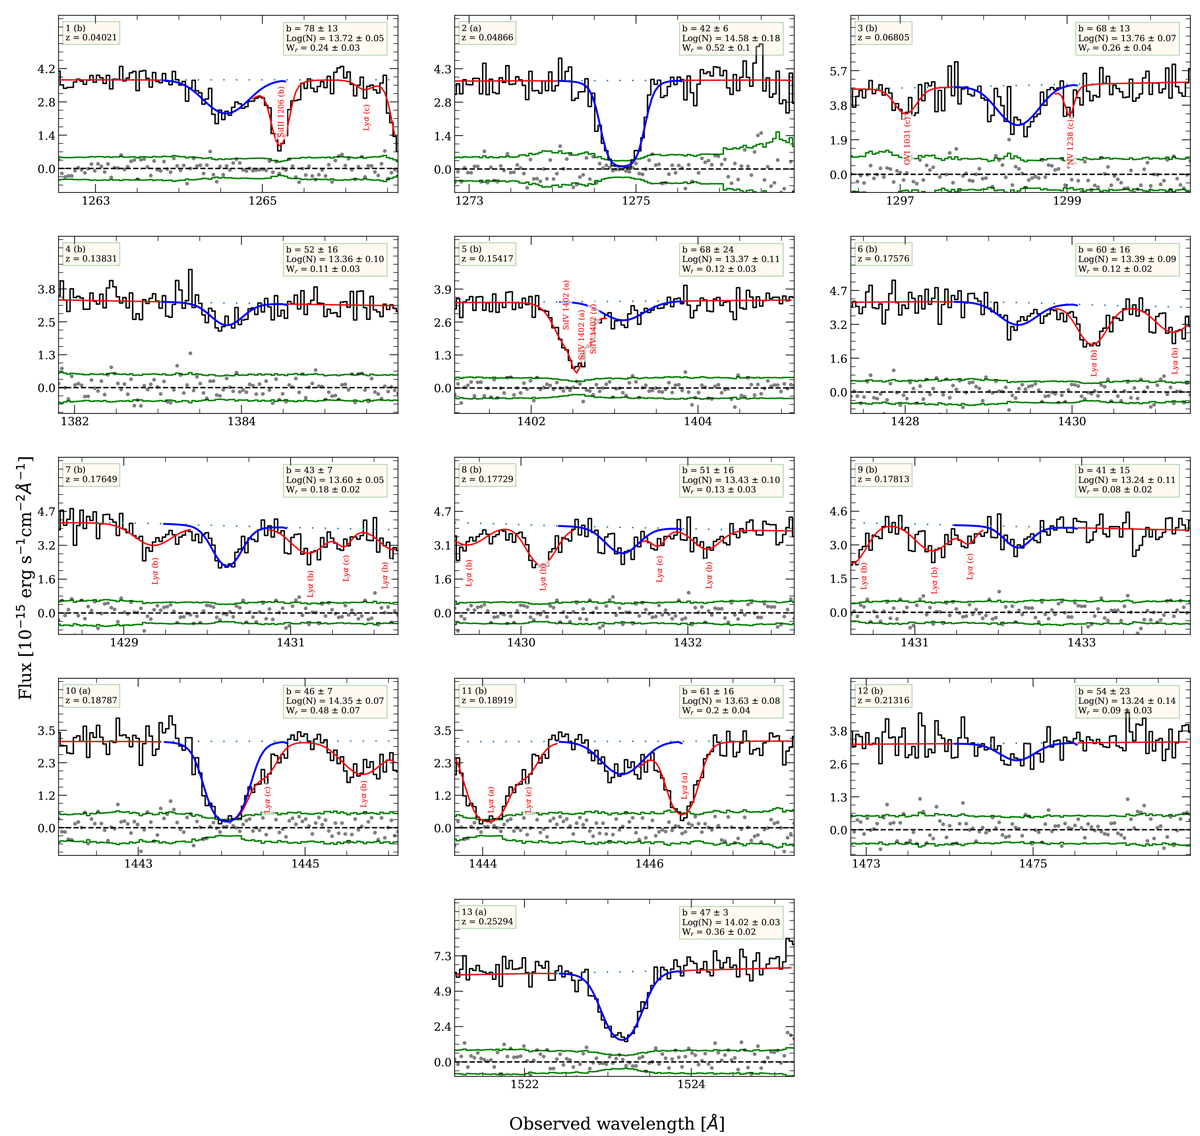
Identified BLAs in the HST/COS spectrum of SDSSJ161940.56+254323.0. The panels show the best-fitting Voigt profile for each BLA in blue and the full model of the QSO spectrum in red. The dotted line shows the continuum level. Additional modeled transitions in the same wavelength range are labeled in red. The derived observational parameters column density log(N/cm−2), Doppler parameter in km s−1, equivalent width in Å, and redshift are indicated in each panel, together with the reliability of the identification (see Sect. 2.7 for details). For saturated lines, our method leads to unrealistically large Wr uncertainties due to the poor column density constraint.
Current usage metrics show cumulative count of Article Views (full-text article views including HTML views, PDF and ePub downloads, according to the available data) and Abstracts Views on Vision4Press platform.
Data correspond to usage on the plateform after 2015. The current usage metrics is available 48-96 hours after online publication and is updated daily on week days.
Initial download of the metrics may take a while.