Fig. 5.
Download original image
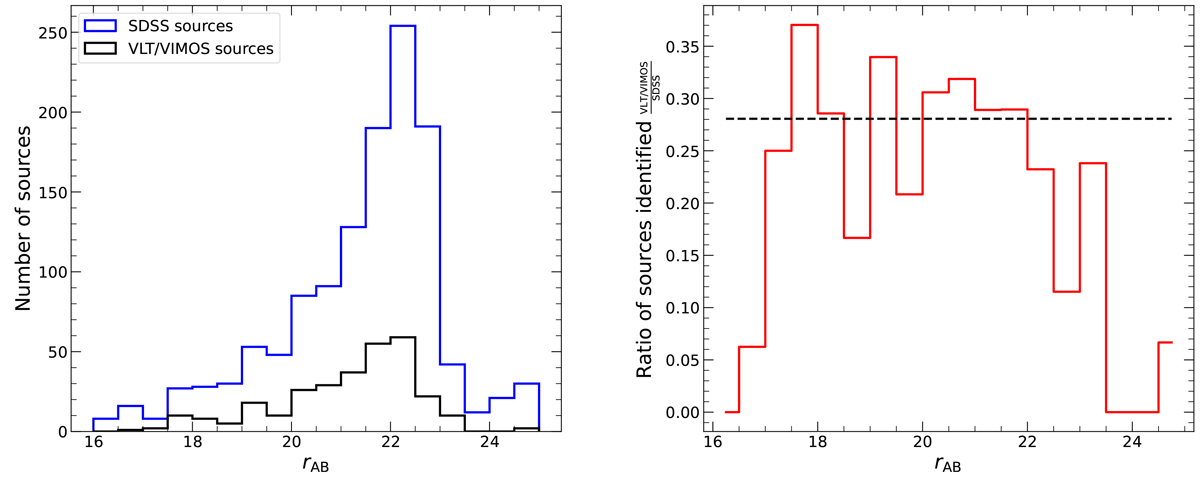
Left: Total number of sources in the SDSS DR16 data that satisfies the imposed color criteria of R − I < 0.7 (blue) and number of sources in our VIMOS survey (black) per magnitude bin. Right: Ratio between the total number of sources in the SDSS DR16 data and our VIMOS survey per magnitude bin. The dashed black line mark the mean of this fraction, for the 17.5 < r < 22.5 interval. On average, we have recovered ∼27% of the sources present on the field with our target selection.
Current usage metrics show cumulative count of Article Views (full-text article views including HTML views, PDF and ePub downloads, according to the available data) and Abstracts Views on Vision4Press platform.
Data correspond to usage on the plateform after 2015. The current usage metrics is available 48-96 hours after online publication and is updated daily on week days.
Initial download of the metrics may take a while.