Fig. 3.
Download original image
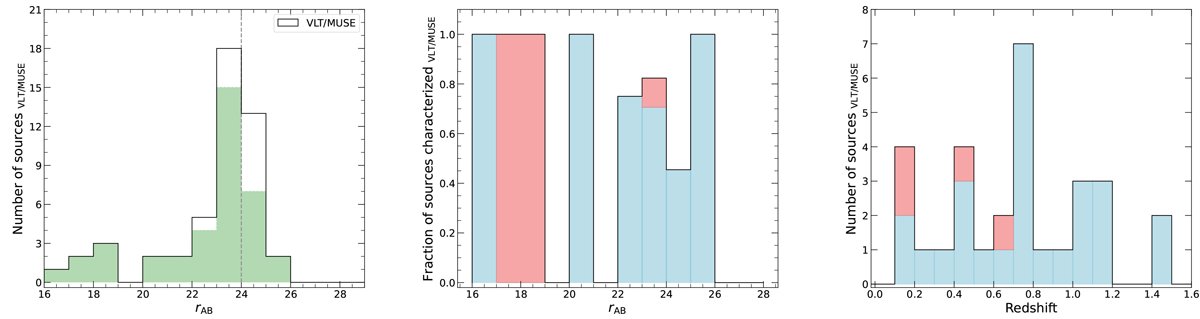
Left: Survey histogram colored in green for our VLT/MUSE sample with measured redshifts. The black line shows the distribution for the whole sample detected by SExtractor. The distribution suggest a detection threshold of around r ∼ 24 mag, indicated with the vertical dashed line. Center: Completeness fraction of the redshift survey. The star forming galaxies and non-star forming galaxies are shown in blue and red, respectively (stars are not included). We reach to ∼78% successful characterization fraction at an apparent magnitude rAB = 24 mag. Right: Redshift distribution of our full characterized galaxy sample colored by the star forming and non-star forming fraction, same as the central panel.
Current usage metrics show cumulative count of Article Views (full-text article views including HTML views, PDF and ePub downloads, according to the available data) and Abstracts Views on Vision4Press platform.
Data correspond to usage on the plateform after 2015. The current usage metrics is available 48-96 hours after online publication and is updated daily on week days.
Initial download of the metrics may take a while.