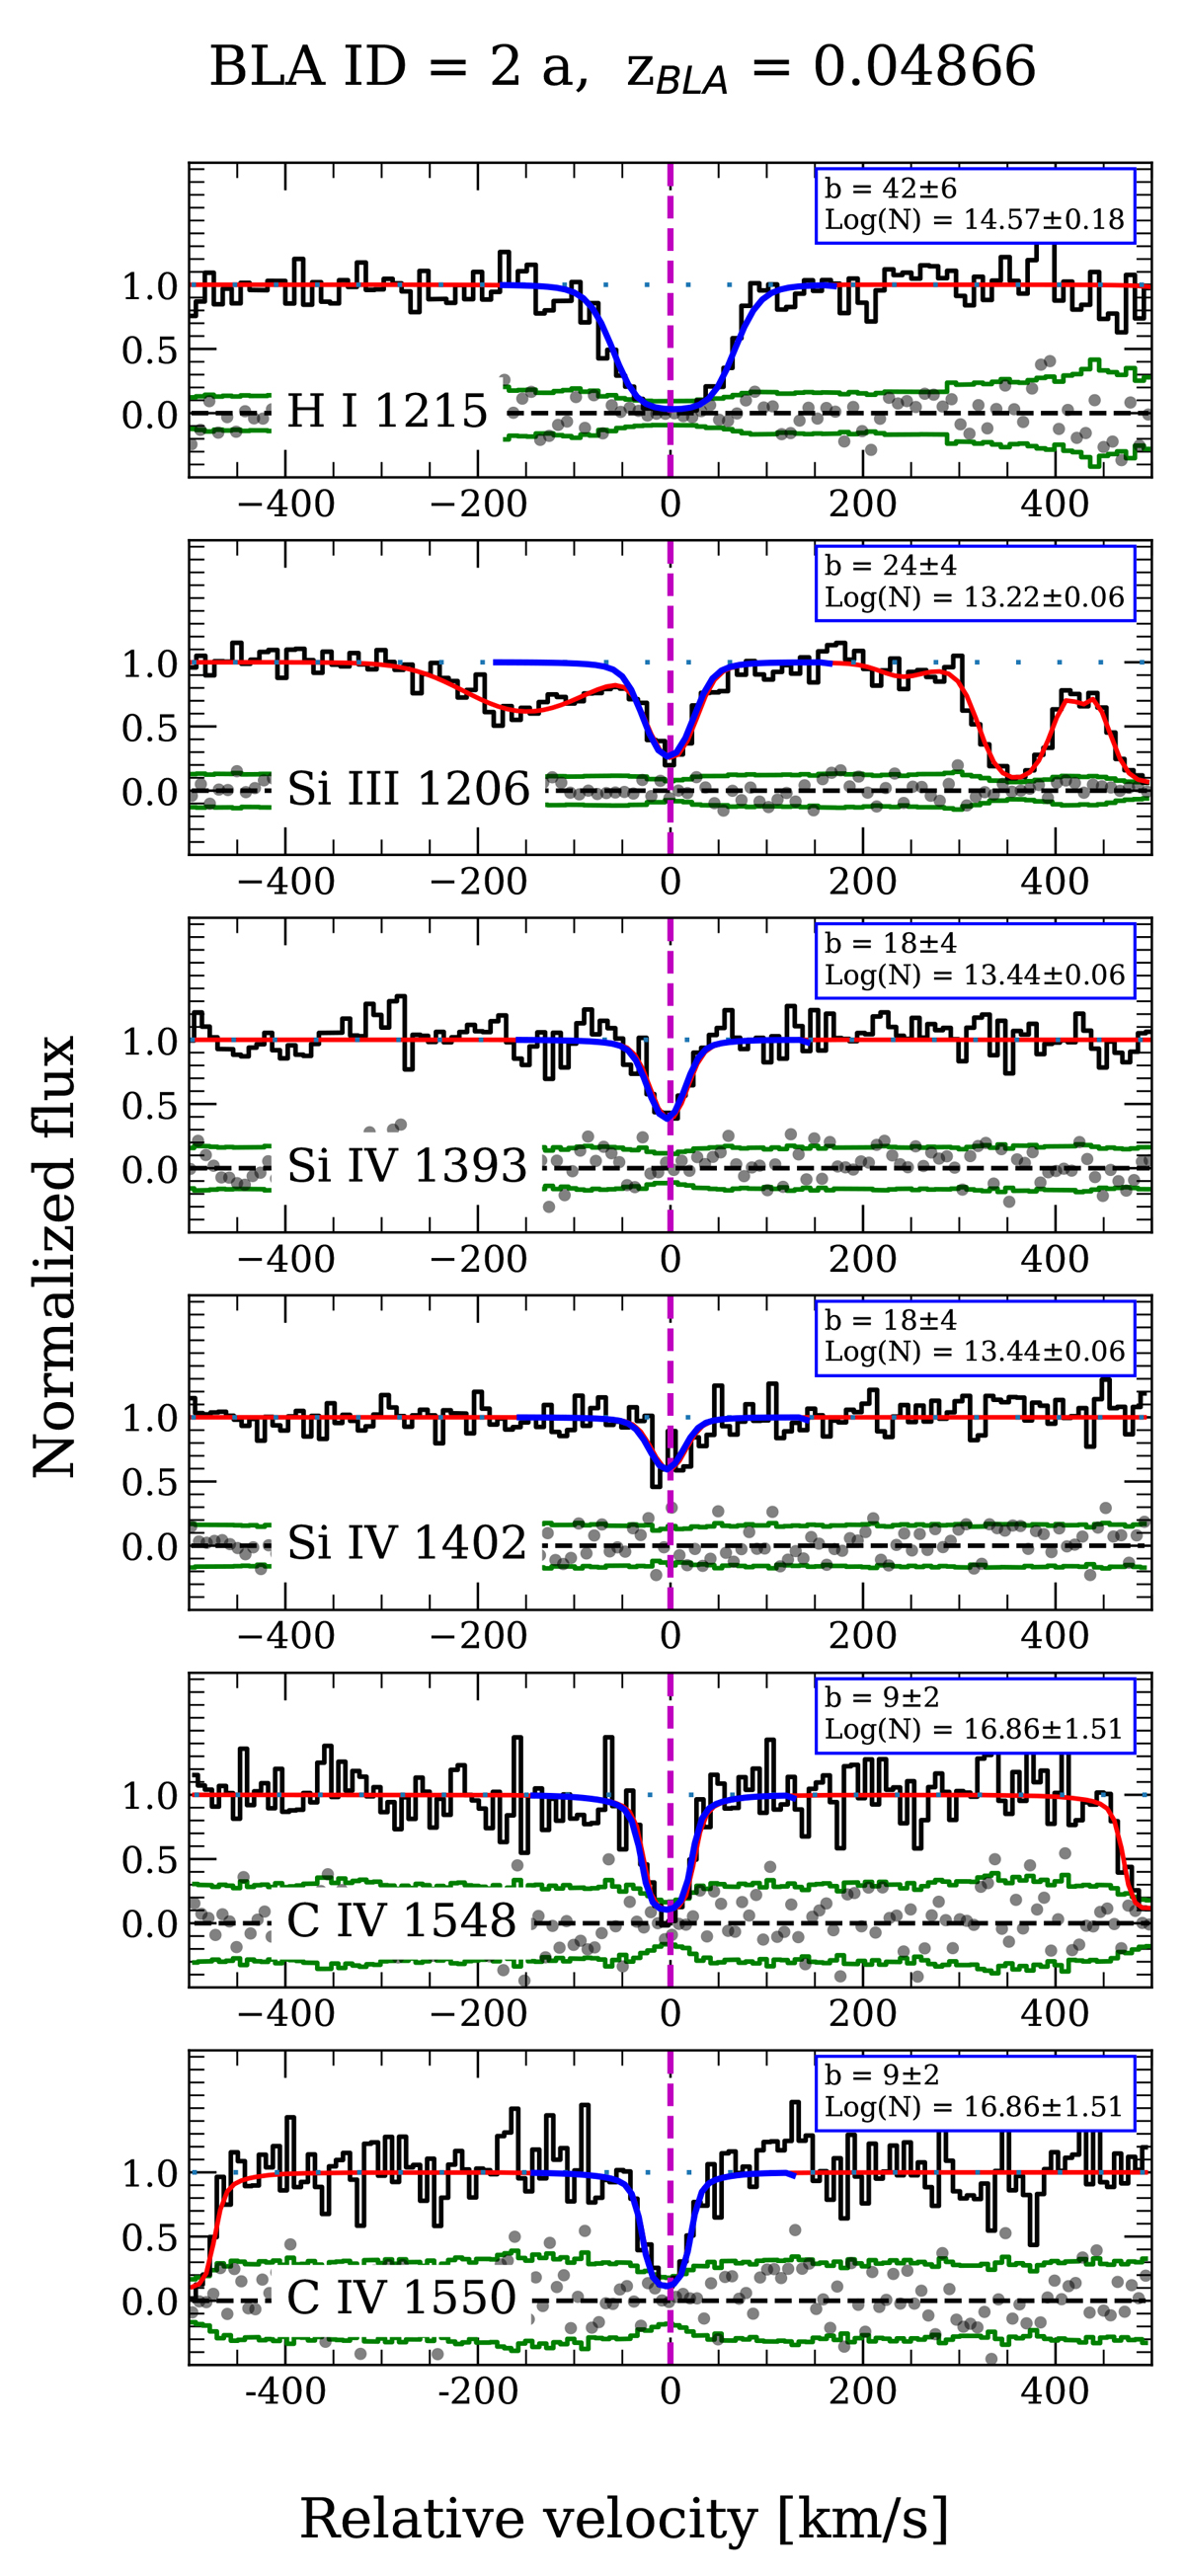
Fig. E.1.
Download original image
H I absorption feature for ID 2 with z = 0.0486. The metals detected in this H I absorption associated kinematically aligned are shown under the BLA (only transitions with reliability “a” and “b” are shown, see Sec. 2.7 for details of the reliability categories). The spectrum is shown in black, and the continuum is shown in blue dots. The best Voigt best profile fit is shown in blue. The observational parameters of the Dopper parameter in km s−1 and column density log(N/cm−2) are shown in the upper right part of the panels.
Current usage metrics show cumulative count of Article Views (full-text article views including HTML views, PDF and ePub downloads, according to the available data) and Abstracts Views on Vision4Press platform.
Data correspond to usage on the plateform after 2015. The current usage metrics is available 48-96 hours after online publication and is updated daily on week days.
Initial download of the metrics may take a while.