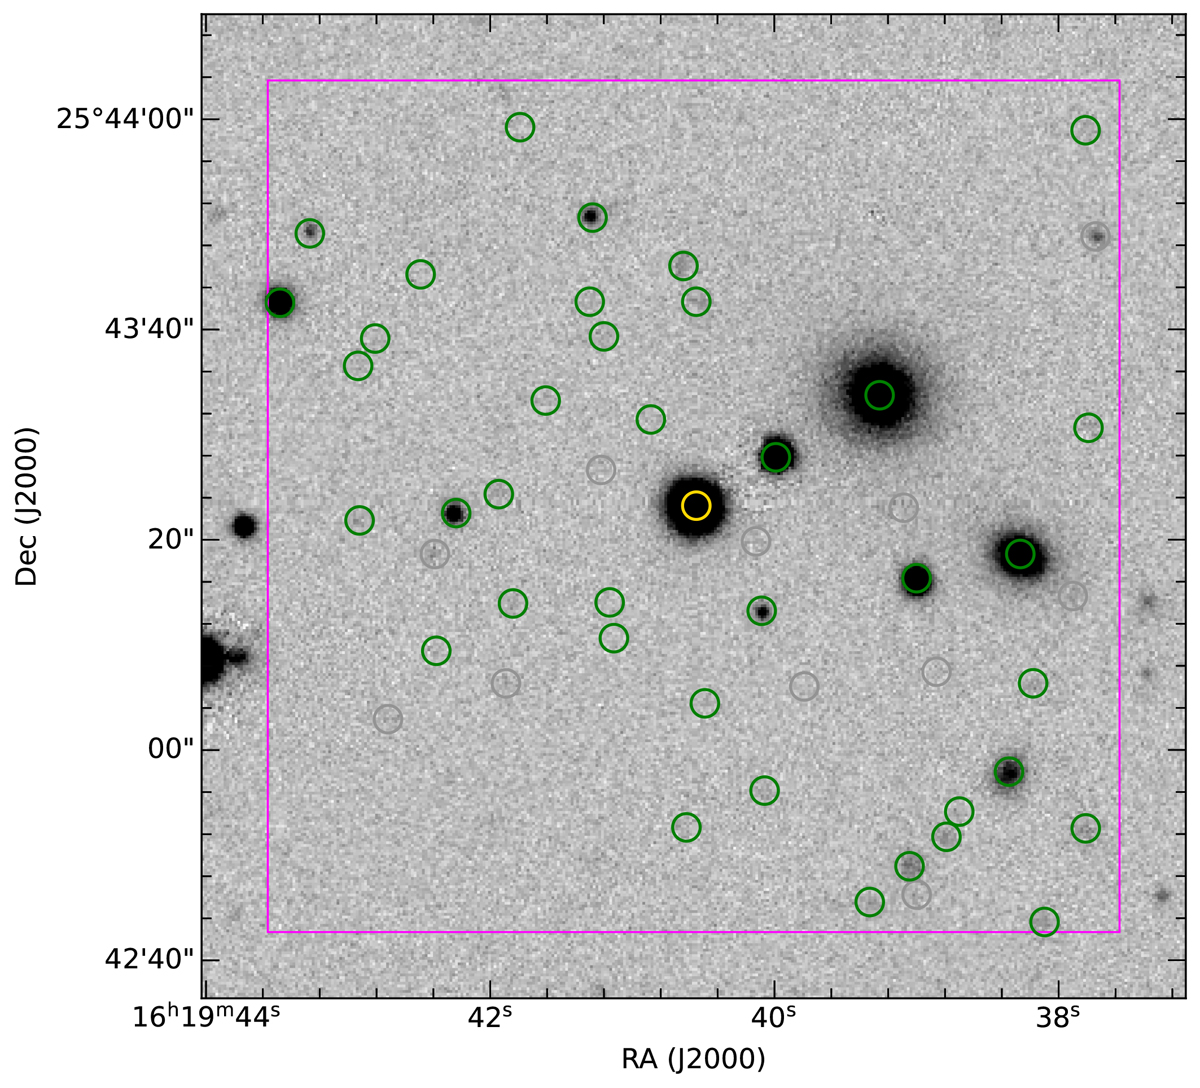
Fig. 2.
Download original image
Combined FoV of our VLT/MUSE observations. The magenta square shows approximately the size of the combined FoV. The background image corresponds to an r-image from The Dark Energy Spectroscopic Instrument (DESI; Dey et al. 2019) Legacy Surveys. The green and gray circles show the sources identified in the field, with and without a redshift measurement, respectively (see Sect. 2.6.1). The central yellow circle corresponds to SDSSJ161940.56+254323.0.
Current usage metrics show cumulative count of Article Views (full-text article views including HTML views, PDF and ePub downloads, according to the available data) and Abstracts Views on Vision4Press platform.
Data correspond to usage on the plateform after 2015. The current usage metrics is available 48-96 hours after online publication and is updated daily on week days.
Initial download of the metrics may take a while.