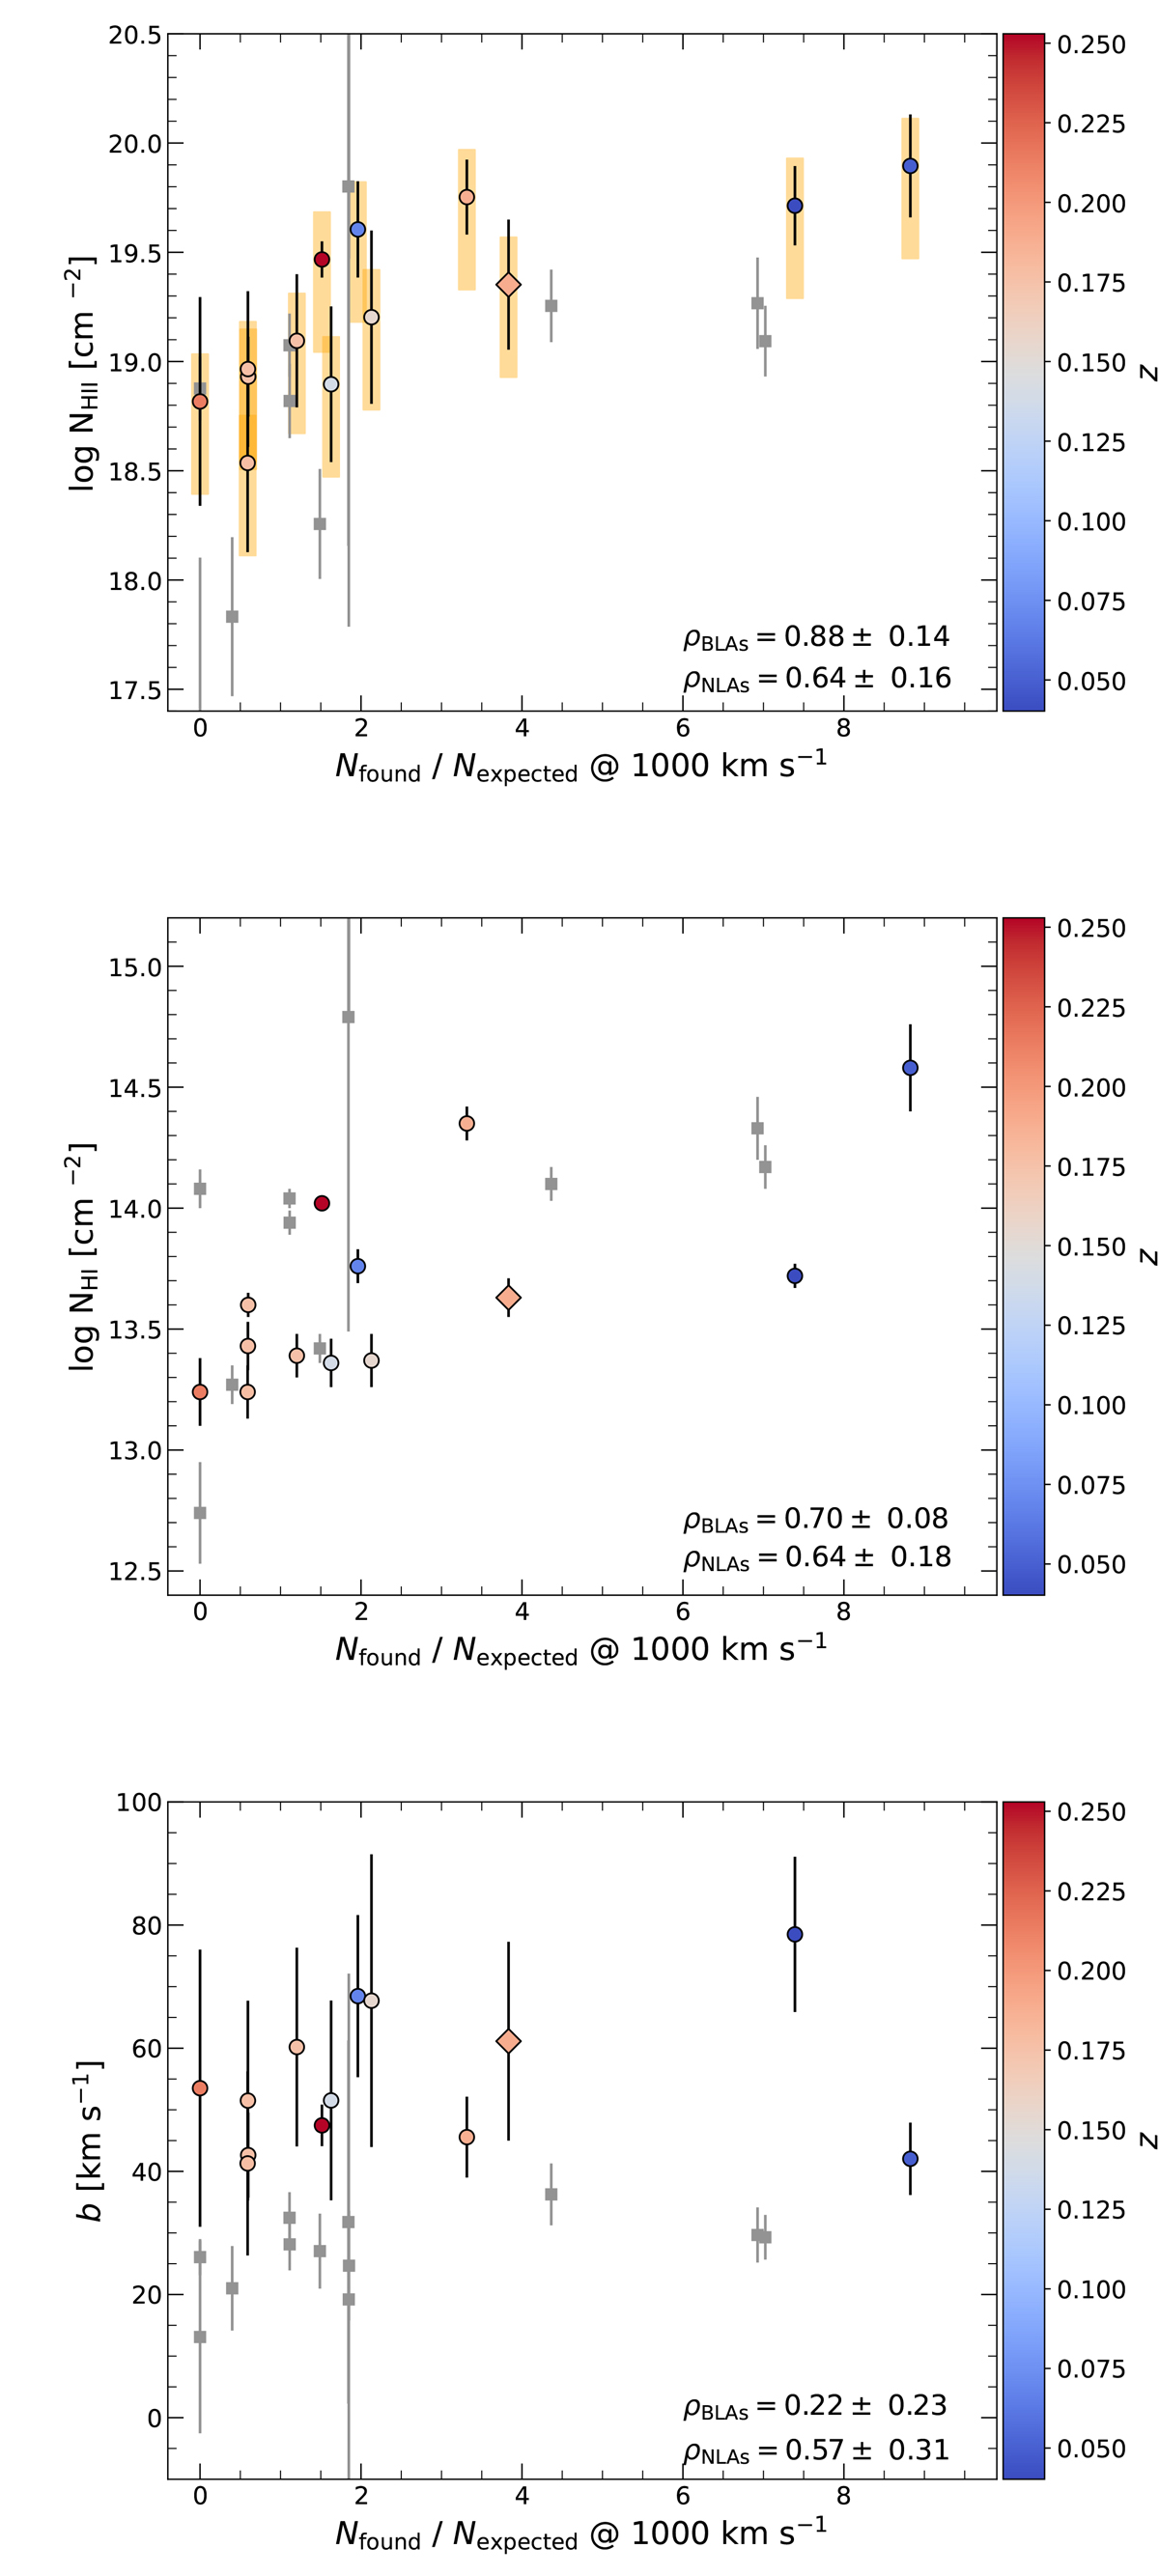
Fig. 14.
Download original image
Correlation between the total ionized hydrogen column density (top), neutral hydrogen column density (middle), and Doppler parameter (bottom) measured for each absorption feature and the completeness-corrected number of galaxies found in our VLT/VIMOS survey at the same redshift, divided by the cosmic average expected. The redshift of each BLA is indicated by the colorbar. The BLA close to a nearby galaxy from our VLT/MUSE survey is indicated with a diamond in the three panels (i.e., that at z ≈ 0.18919). The gray squares correspond to our NLA sample. The orange bars in the top panel quantify the range of variation in the inferred ionized hydrogen column density between the α = 0 and α = 1.5 scenarios (see Sect. 2.7).
Current usage metrics show cumulative count of Article Views (full-text article views including HTML views, PDF and ePub downloads, according to the available data) and Abstracts Views on Vision4Press platform.
Data correspond to usage on the plateform after 2015. The current usage metrics is available 48-96 hours after online publication and is updated daily on week days.
Initial download of the metrics may take a while.