Fig. 1.
Download original image
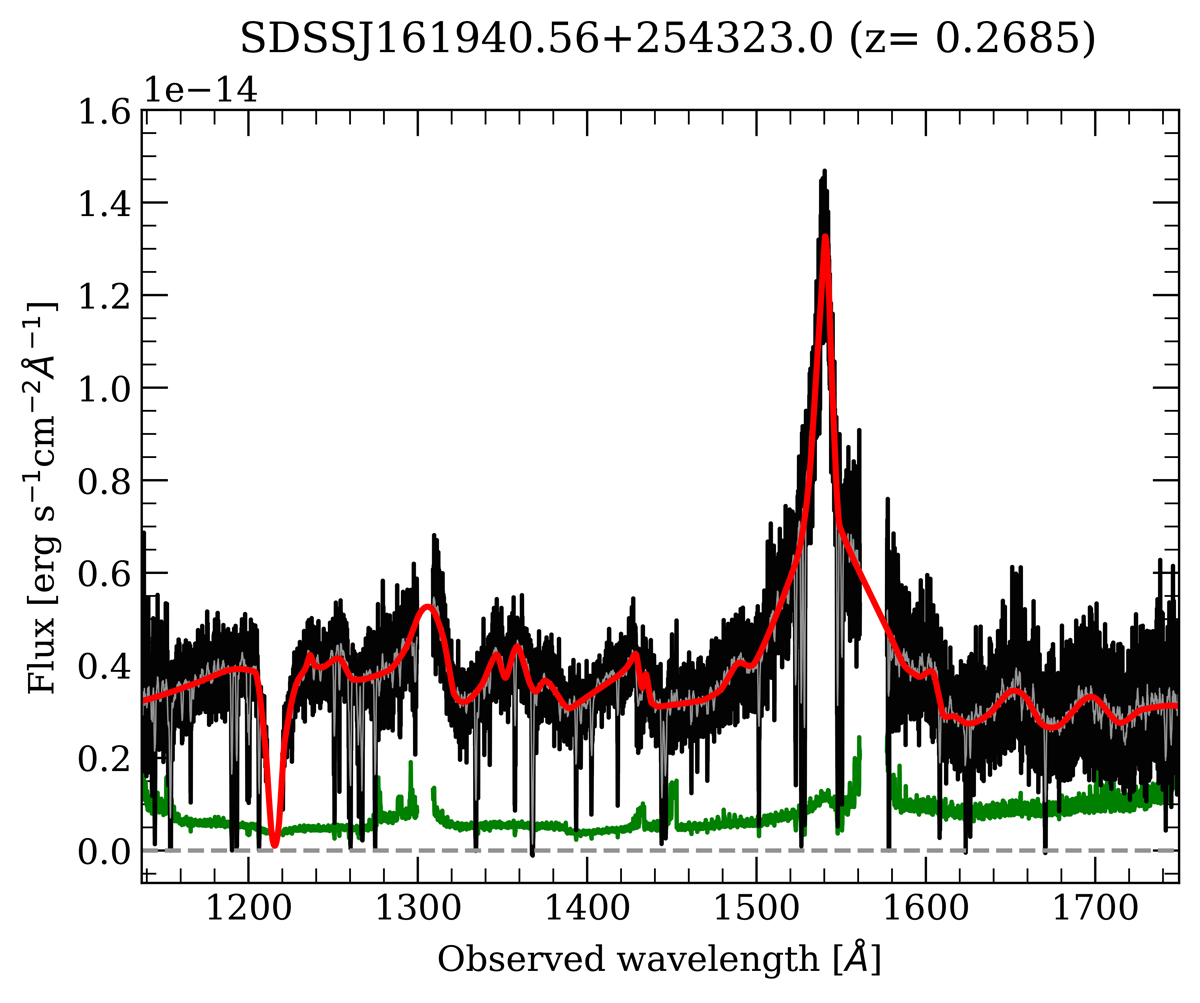
Observed HST/COS FUV spectrum of QSO SDSSJ161940.56+254323.0 in black. The green line shows the 1 − σ uncertainty of the spectrum. The red line corresponds to the modeled pseudo-continuum. The gray line shows the HST spectrum convolved with a Gaussian kernel with a FWHM of 1 Å. Figure 6 shows a zoom-in of the QSO spectrum at their wavelengths.
Current usage metrics show cumulative count of Article Views (full-text article views including HTML views, PDF and ePub downloads, according to the available data) and Abstracts Views on Vision4Press platform.
Data correspond to usage on the plateform after 2015. The current usage metrics is available 48-96 hours after online publication and is updated daily on week days.
Initial download of the metrics may take a while.