Fig. 8
Download original image
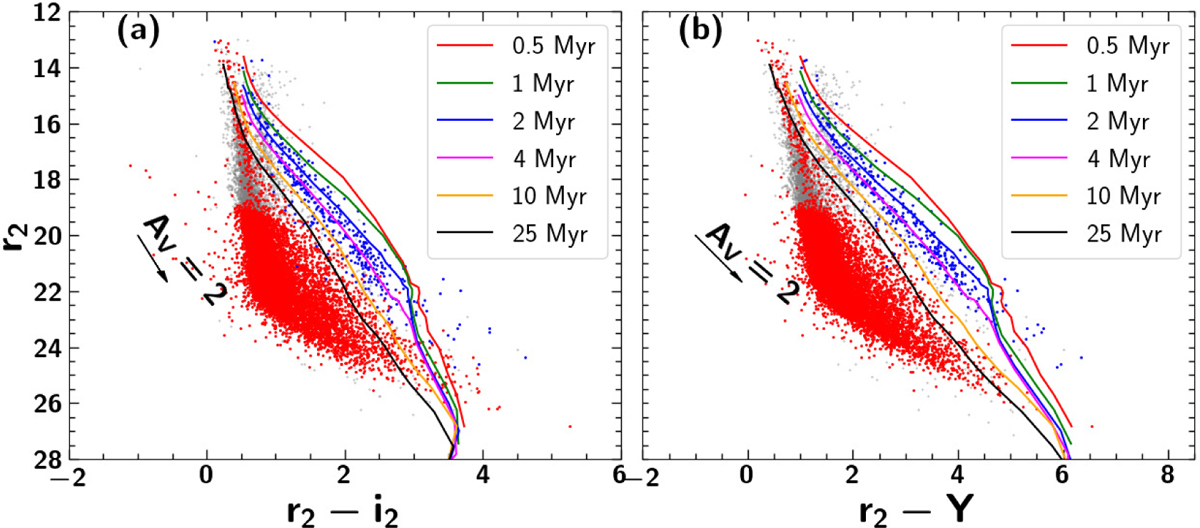
CMD plots of r2 vs r2 – i2 (a) and r2 vs r2 – Y (b) for sources within the 30′ circle. Grey dots are the total 14 685 HSC+UKIDSS stars within the circle. The blue dots are the 399 stars detected as cluster population by the RF method, and the red dots are the 11 057 stars with PRF ⩽ 0.5. The isochrone curves and the black arrow have the same meaning as in Fig. 6.
Current usage metrics show cumulative count of Article Views (full-text article views including HTML views, PDF and ePub downloads, according to the available data) and Abstracts Views on Vision4Press platform.
Data correspond to usage on the plateform after 2015. The current usage metrics is available 48-96 hours after online publication and is updated daily on week days.
Initial download of the metrics may take a while.