Fig. 6
Download original image
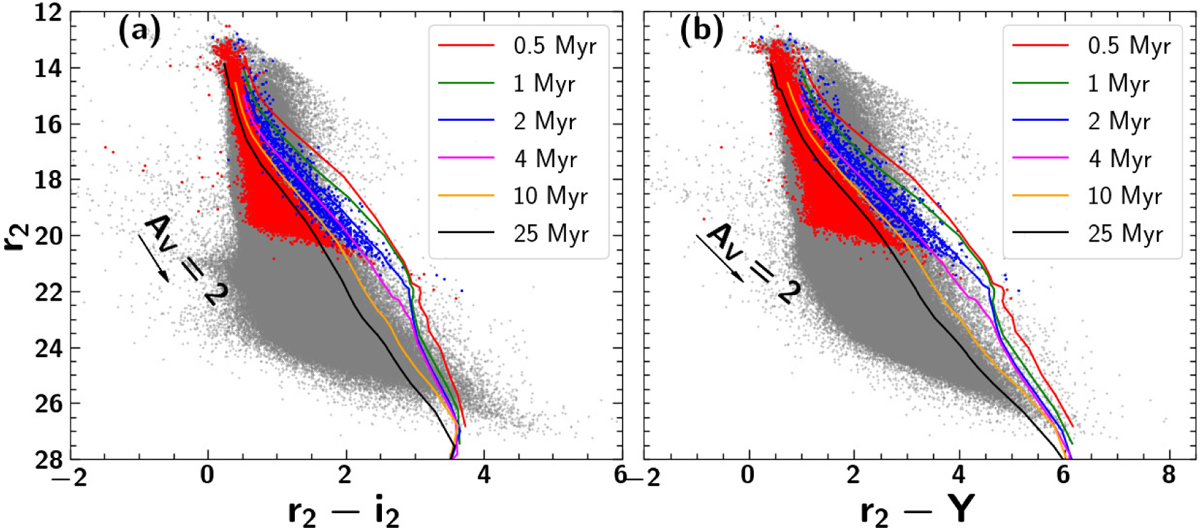
r2 vs r2–i2 and r2 vs r2–Y CMD plots are shown in this figure. The grey dots are the complete HSC+UKIDSS 802 100 sources, the red dots are the non-member population, and the blue dots are the candidate members of the training set. Isochrones of age 0.5, 1, 2, 4, 10, and 25 Myr from Baraffe et al. (2015) are plotted after correcting for visual extinction of AV = 1 mag and distance of 917 pc. Reddening laws of Wang & Chen (2019) are used to correct the extinction of isochrones. The length and direction of the reddening vector of AV = 2 mag is shown as the black arrow. Details regarding the use of the extinction and distance values are explained in Section 6.1.
Current usage metrics show cumulative count of Article Views (full-text article views including HTML views, PDF and ePub downloads, according to the available data) and Abstracts Views on Vision4Press platform.
Data correspond to usage on the plateform after 2015. The current usage metrics is available 48-96 hours after online publication and is updated daily on week days.
Initial download of the metrics may take a while.