Open Access
Fig. C.3
Download original image
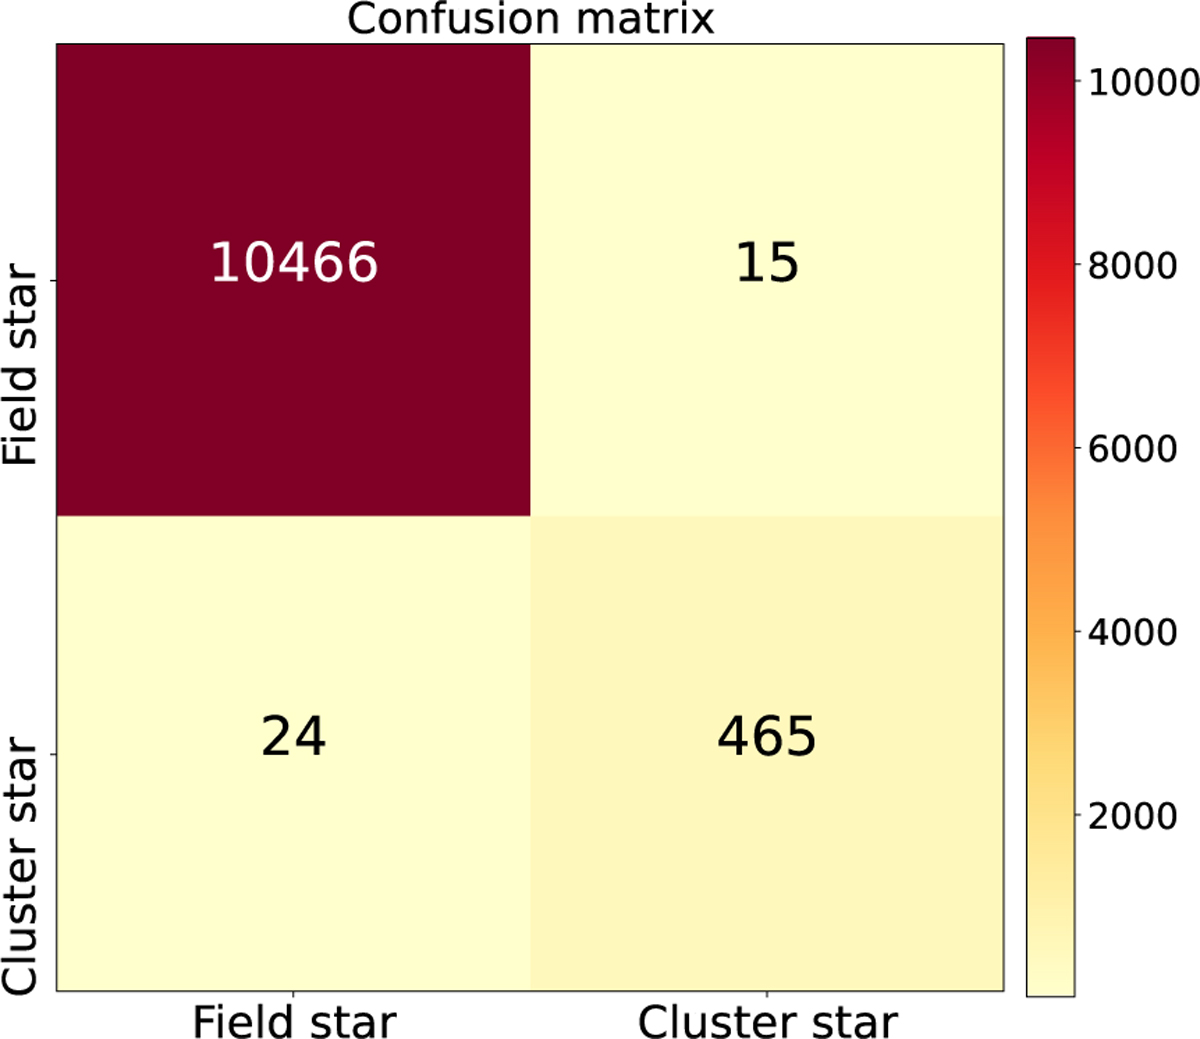
The figure shows the confusion matrix generated by the RF method for the entire star-forming complex. The cluster stars and field stars are displayed in the plot. The colour bar represents the variation in the number of objects within each cell of the confusion matrix.
Current usage metrics show cumulative count of Article Views (full-text article views including HTML views, PDF and ePub downloads, according to the available data) and Abstracts Views on Vision4Press platform.
Data correspond to usage on the plateform after 2015. The current usage metrics is available 48-96 hours after online publication and is updated daily on week days.
Initial download of the metrics may take a while.