Open Access
Fig. 2
Download original image
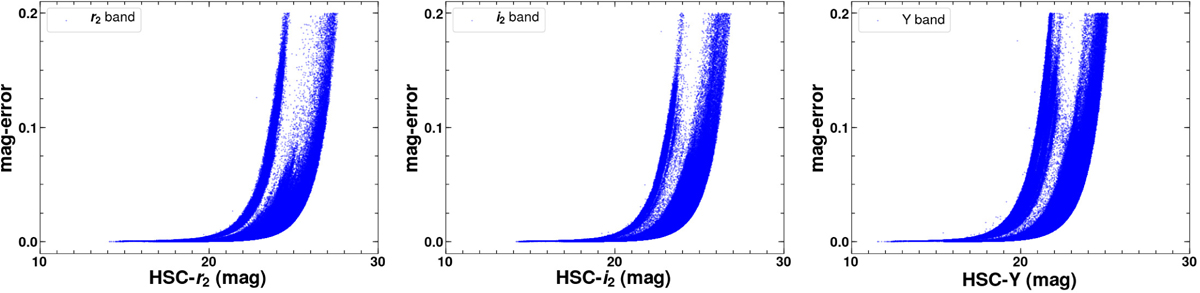
Plots showing the distribution of photometric magnitude with respect to its error in individual HSC bands. The two separate populations are due to the photometry obtained from the long and short exposure frames.
Current usage metrics show cumulative count of Article Views (full-text article views including HTML views, PDF and ePub downloads, according to the available data) and Abstracts Views on Vision4Press platform.
Data correspond to usage on the plateform after 2015. The current usage metrics is available 48-96 hours after online publication and is updated daily on week days.
Initial download of the metrics may take a while.