Open Access
Fig. B.1
Download original image
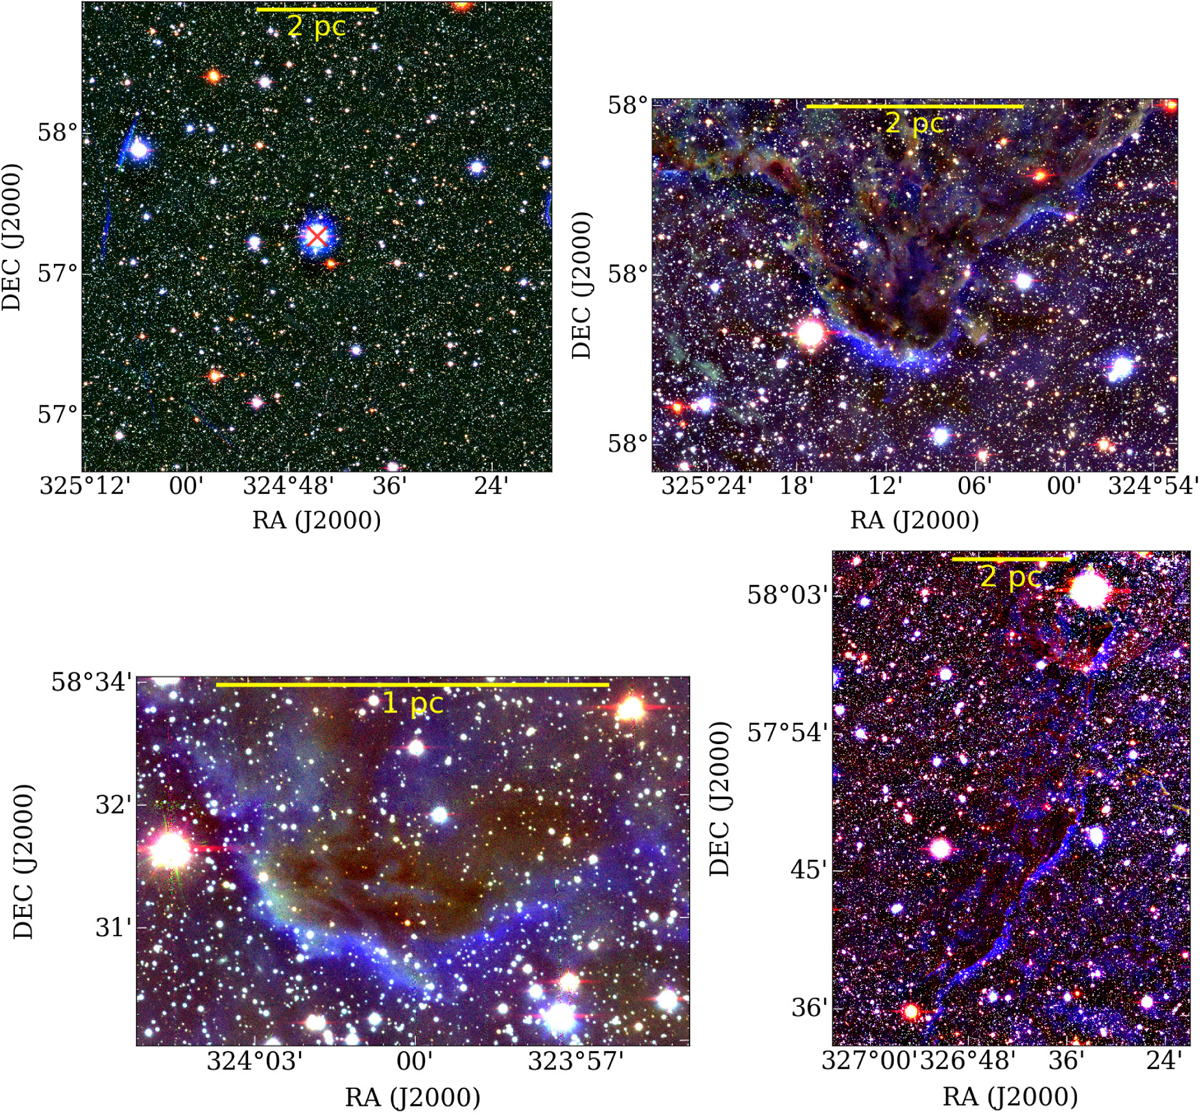
Same as Fig. 5, but for the regions of the central part of the complex (top left), region towards BRCs IC 1396 N (top right), SFO 35 (bottom left), and IC 1396 G (bottom right), respectively. Scale bars of 2 pc and 1 pc are shown on the images.
Current usage metrics show cumulative count of Article Views (full-text article views including HTML views, PDF and ePub downloads, according to the available data) and Abstracts Views on Vision4Press platform.
Data correspond to usage on the plateform after 2015. The current usage metrics is available 48-96 hours after online publication and is updated daily on week days.
Initial download of the metrics may take a while.