Fig. B.1.
Download original image
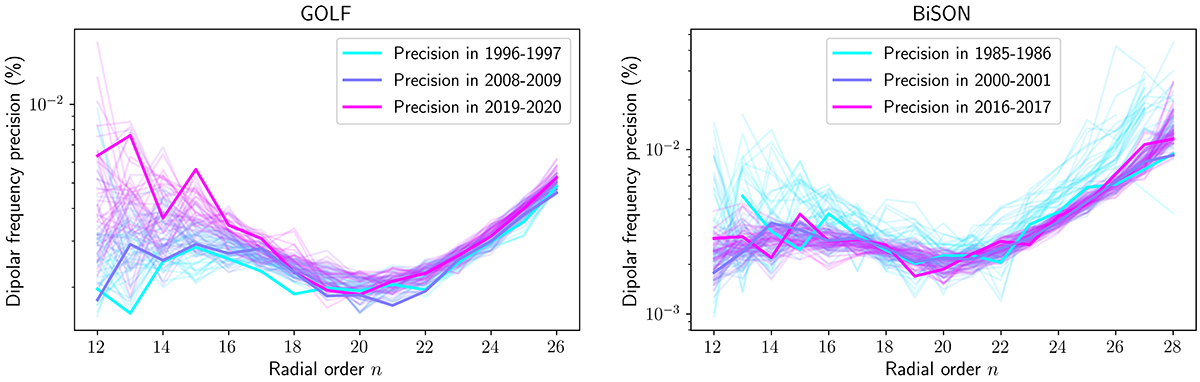
Evolution of the observational precision achieved for frequency of dipolar modes detected by the GOLF instrument (upper panel) and the BiSON network (lower panel). Each line corresponds to a yearly snapshot and the color map transitions from bluish colors for the early instrument years to pinkish colors for the recent years.
Current usage metrics show cumulative count of Article Views (full-text article views including HTML views, PDF and ePub downloads, according to the available data) and Abstracts Views on Vision4Press platform.
Data correspond to usage on the plateform after 2015. The current usage metrics is available 48-96 hours after online publication and is updated daily on week days.
Initial download of the metrics may take a while.