| Issue |
A&A
Volume 697, May 2025
|
|
|---|---|---|
| Article Number | A237 | |
| Number of page(s) | 7 | |
| Section | Stellar structure and evolution | |
| DOI | https://doi.org/10.1051/0004-6361/202554256 | |
| Published online | 22 May 2025 | |
Optical observations of the peculiar high-mass X-ray binary 4U 2206+54
1
Institute of Astronomy and National Astronomical Observatory, Bulgarian Academy of Sciences, Tsarigradsko Chaussee 72, BG-1784 Sofia, Bulgaria
2
Nicolaus Copernicus Astronomical Center, Polish Academy of Sciences, Bartycka 18, PL-00-716 Warszawa, Poland
3
Astrophysikalisches Institut und Universitäts-Sternwarte Jena, Schillergäßchen 2-3, 07745 Jena, Germany
4
Byurakan Astrophysical Observatory, Byurakan, 0213 Aragatzotn, Armenia
5
Astrophysical Research Laboratory of Physics Institute, Yerevan State University, Yerevan, Armenia
⋆ Corresponding author: This email address is being protected from spambots. You need JavaScript enabled to view it.
Received:
25
February
2025
Accepted:
15
April
2025
Abstract
Context. We present results from the high-resolution optical spectroscopy and spectropolarimetry of the peculiar high-mass X-ray binary 4U 2206+54.
Aims. We aim to estimate the size of the circumstellar disc and investigate the interaction between the compact object and the matter in the disc. We also study the interstellar polarisation towards 4U 2206+54.
Methods. We performed a periodogram analysis on the spectral data to identify periodicities. We estimated the radius of the circumstellar disc and the distance between the components at periastron. We used two methods to determine the interstellar polarisation towards 4U 2206+54, both of which yield similar results.
Results. We estimate that the outer radius of the Hα-emitting circumstellar disc varies between 7.9 and 15.2 R⊙ with an average value of 10.9 R⊙. This suggests that when the disc is small, the neutron star does not reach the outer parts of the circumstellar disc. Based on our spectropolarimetric observations of 4U 2206+54, we can conclude that the dominant component of the polarisation is interstellar. A depolarisation effect is visible in the Hα emission line, which indicates intrinsic polarisation. We estimate that the intrinsic degree of polarisation in the synthetic V band is Pint (V) (%) = 0.5 ± 0.2 at the position angle PAint (V)≈47°.
Key words: stars: emission-line, Be / X-rays: binaries
© The Authors 2025
 Open Access article, published by EDP Sciences, under the terms of the Creative Commons Attribution License (https://creativecommons.org/licenses/by/4.0), which permits unrestricted use, distribution, and reproduction in any medium, provided the original work is properly cited.
This article is published in open access under the Subscribe to Open model. This email address is being protected from spambots. You need JavaScript enabled to view it. to support open access publication.
1. Introduction
Be/X-ray binary stars represent a subclass of high-mass X-ray binary stars. They contain a main-sequence OBe star, which acts as a mass donor, and a compact object (neutron star or black hole) as the companion. OBe stars are non-supergiant, fast-rotating stars that show emission lines in their spectra (Balona 2000; Rivinius et al. 2013). The origin of the emission lines is attributed to an equatorial disc fed by the material ejected from the rapidly rotating donor star. The exact mechanism behind this mass ejection and disc formation is not yet known (Rivinius et al. 2013). During periastron, the compact object passes close to or through the disc, causing significant disruption and disc truncation (Reig et al. 1997; Okazaki & Negueruela 2001). Because the truncation radius is smaller than the orbit, the compact object does not typically pass through the disc. The conversion of kinetic energy from the infalling material into radiation triggers X-ray emission.
The Be/X-ray binary star 4U 2206+54 (V1008 Cep, BD+53 2790, and LS III +54 16) lies at a distance of 3104 pc (Bailer-Jones et al. 2021). The mass donor is an O9.5Vp star with a higher-than-normal abundance of helium that underfills its Roche lobe and loses mass via a slow dense stellar wind at υ ∼ 350 km s−1 (Ribó et al. 2006). The compact object is a neutron star with a strong magnetic field (Torrejón et al. 2004) and a spin period of Ps = 5554 ± 9 s (Finger et al. 2010). Stoyanov et al. (2014) suggested an orbital period of 9.5 d, which was later confirmed by Hambaryan et al. (2022). The slow X-ray pulsations observed (Reig et al. 2009; Finger et al. 2010) and the rapid spin-down rate of the neutron star (Ikhsanov & Beskrovnaya 2013; Jain et al. 2022) indicate a magnetic field of ∼1013 − 1014 G, an estimate confirmed by Torrejón et al. (2018). A magnetic field of that order means the neutron star must be an accreting magnetar (Reig et al. 2012). The system meets the criteria for being a persistent X-ray source due to its slow neutron star rotation and low-amplitude X-ray emission. The high-mass X-ray binary 4U 2206+54 was ejected from the OB association Cep OB1 about 2.8 ± 0.4 Myr ago in a supernova event (Hambaryan et al. 2022).
2. Observations
2.1. Spectral observations
The spectral data we report here were obtained with the 2-metre Ritchey-Chrétien-Coudé (2 m RCC) telescope at the Rozhen National Astronomical Observatory in Bulgaria. Between November 2011 and July 2014, we secured 65 spectra of 4U 2206+54 with the telescope’s Coudé spectrograph. We obtained 15 additional spectra of the object with the Echelle Spectrograph Rozhen (ESpeRo) (Bonev et al. 2017) between January 2014 and August 2024. The Coudé spectra have a dispersion of 0.1 Å px−1 or 0.2 Å px−1, while the ESpeRo spectra have a dispersion of 0.06 Å px−1 at 6560 Å. The profiles of the Hα emission line are double-peaked, which is typical for a Be star that forms a circumstellar disc (Porter & Rivinius 2003; Zamanov et al. 2023).
The spectra were reduced in the standard way, which included bias removal, flat-field correction, wavelength calibration, and correction for the Earth’s motion. Pre-processing and measurements were performed using standard routines provided by the Image Reduction and Analysis Facility (IRAF; Tody 1993) and checked using the specutils package affiliated with the Astropy project (Astropy Collaboration 2013). The spectra obtained on each night of observation were processed and measured independently. We measured the equivalent widths (EWs) and full widths at half maximum (FWHMs) of the blue peaks and red peaks, as well as the central dip in each spectrum. We also measured their heliocentric radial velocities (RVs) employing a Gaussian fit to the emission lines. The errors, which we estimated to be approximately 5% for the EWs and FWHMs and approximately 10 km s−1 for the RVs, depend mainly on the signal-to-noise ratio. A few examples of the Hα emission lines in our spectra are plotted in Fig. 1.
 |
Fig. 1. Five examples of Hα emission line profiles. |
2.2. Spectropolarimetric observations
Spectropolarimetric observations of 4U 2206+54 and the stars in the direction of 4U 2206+54 were secured with the Two-Channel-Focal-Reducer Rozhen (FoReRo2; Jockers et al. 2000), attached to the Cassegrain focus of the 2 m RCC telescope. FoReRo2 is a versatile instrument that provides numerous observational capabilities, including broadband and narrowband filter imaging, long-slit low-dispersion spectroscopy, Fabry-Perot interferometry, imaging polarimetry, and low-dispersion spectropolarimetry. In polarimetric and/or spectropolarimetric mode, FoReRo2 is equipped with a λ/2 retarder and a Wollaston prism. Polarised spectra were obtained at eight retarder angles (i.e. 0°, 22.5°, 45°, 67.5°, 90°, 112.5°, 135°, and 157.5°) using a Super-Achromatic True Zero-Order Waveplate-5 (APSAW-5)1 retarder. A beam-swapping technique (Bagnulo et al. 2009) was used to minimise instrumental polarisation. Standard stars with zero degrees of polarisation were used to correct for instrumental polarisation. The offset between the position angle in the celestial and instrumental polarisation frames was corrected using strongly polarised standard stars. The observations were carried out from 5 October 2018 to 24 October 2019. Table 1 provides the observation journal and contains the following information: the list of objects, the date (in YYYYMMDD format), the UT at the start of the observation, the total exposure time for all the retarder angles, the angular distance from 4U 2206+54, and the distance. The last two columns give the observed degree of polarisation and the position angle measured using a synthetic V-band filter.
Spectropolarimetric observations of 4U 2206+54 and the stars in the direction of 4U 2206+54.
3. Long-term Hα emission line variability
Figures 2, 3, and 4 show the long-term variability of the measured parameters of the Hα emission line. An anti-correlation is present between the EWs of the peaks and the full line, as well as between the ratios of the EWs of the peaks. We applied a Lomb-Scargle analysis to the data in order to detect orbital modulation and to search for a possible super-orbital period, which has been observed in other Be/X-ray binaries. The detection of the 19.25-day X-ray period (Corbet et al. 2007) at optical wavelengths is of particular interest. However, the results from the periodogram analysis are not robust enough to confirm the presence of any periodicities in our data. The uneven sampling of the data made it difficult to precisely determine any periodicities, especially super-orbital periods. Nevertheless, we folded the data using the orbital period. As shown in Figs. 5, 6, and 7, the parameters of the Hα emission line are variable. This variability is probably caused by the influence of the compact object, and future studies of the nature of this variability will be important not only for 4U 2206+54, but also for other Be/X-ray binaries.
 |
Fig. 2. Long-term variability of the measured EWs of the Hα emission line. From top to bottom: EW(B), EW(R), EW(D), the ratio of EW(B) to EW(R), and EW(Hα). |
 |
Fig. 3. Long-term variability of the measured FWHMs of the Hα emission line. From top to bottom: FWHM(B), FWHM(R), FWHM(D), and the ratio of FWHM(B) to FWHM(R). |
 |
Fig. 4. Long-term variability of the RVs of the blue and red peaks, and the central dip of the Hα emission line. |
 |
Fig. 5. EWs of the Hα emission line folded using the orbital period of 4U 2206+54. |
 |
Fig. 6. FWHMs of the Hα emission line folded using the orbital period of 4U 2206+54. |
 |
Fig. 7. RVs of the Hα emission line folded using the orbital period of 4U 2206+54. |
4. Circumstellar disc
For rotationally dominated profiles, the separation between the blue and red peaks (ΔV) of the Hα emission line can be considered a measure of the outer radius of the Hα-emitting circumstellar disc (Huang 1972) given by
 (1)
(1)
where j = 0.5 for Keplerian rotation and j = 1 for conservation of angular momentum. We adopted j = 0.5 because the kinematic evidence for Be stars points to a velocity field dominated by Keplerian rotation, with little or no radial flow (Hummel & Vrancken 2000; Hanuschik 2000; Porter & Rivinius 2003). Equation 1 relies on the assumptions that (1) the Be star is rotating its critical rate and (2) the line profile shape is dominated by kinematics. Radiative transfer does not play a role. The current view is that Be stars rotate at 70–80% of the critical rate (Porter 1996; Chauville et al. 2001). Hummel & Dachs (1992) showed that, at greater optical depths, the emission line peaks are shifted towards lower velocities. This means smaller peak separations. The peak separation of the Hα line is smaller than that of the Hβ line and is likely also smaller than the true kinematic value (Hanuschik et al. 1988; Zamanov et al. 2023). Bearing in mind these effects, we used the following equation to calculate the disc radius:
 (2)
(2)
where ϵ is a dimensionless parameter, for which we adopted the value 0.9 ± 0.1 (Zamanov et al. 2013). In our observations, ΔV varies between approximately 420 km s−1 and 600 km s−1. Following Eq. (2) and using the rotational velocity of the mass donor, v sin i = 315 ± 70 km s−1 (Blay et al. 2006), and the stellar radius R* = 7.3 R⊙ (Ribó et al. 2006), we estimate the radius of the Hα-emitting disc to be in the range 7.9–15.2 R⊙, with an average value of 10.9 R⊙, a median of 10.8 R⊙, and a sample standard deviation of 1.8 R⊙.
Haigh et al. (2004) and Coe et al. (2006) discussed the tendency of disc emission fluxes to clump at specified levels. This tendency is related to resonances between the disc material and orbital periods that truncate the disc at specific radii (Okazaki & Negueruela 2001). These radii can be calculated using the following equation from Grundstrom et al. (2007):
 (3)
(3)
where G is the gravitational constant, M1 is the mass of the primary, and n is the integer number of rotational periods of the gas at the outer edge of the disc per one orbital period. The mass, M1, is ∼10.7 M⊙ (Stoyanov et al. 2014). For 4U 2206+54, we calculate the resonance radii to be R9 = 9.6 R⊙, R8 = 10.4 R⊙, R7 = 11.4 R⊙, R6 = 12.6 R⊙, R5 = 14.3 R⊙, R4 = 16.6 R⊙, and R3 = 20.1 R⊙. The distribution of Rdisc, shown in Fig. 8, indicates that the disc sizes are packed around ∼10 R⊙. In practice, the disc size remains smaller than a 6:1 resonance. The average value of Rdisc is 10.9 R⊙, which corresponds to a 9:1 resonance. The distance between the components depends on the orbital phase, and at periastron it is given by
 (4)
(4)
 |
Fig. 8. Histogram of Rdisc values. The distribution peak corresponds to Rdisc ≈ 10.4 R⊙. The dashed red lines mark the resonance radii. |
Using the mass ratio (q) and rper, we can estimate the Roche lobe size at periastron (Eggleton 1983) with
 (5)
(5)
The Roche lobe size at periastron is ∼16.9 ± 0.1 R⊙, and the distance between the components at periastron is rper ∼ 30.5 R⊙. Figure 9 shows the orbital variability of the radius of the Hα-emitting circumstellar disc and the distance between the components, while Fig. 10 shows the orbit of the neutron star and the circumstellar disc of 4U 2206+54. Both Figs. 9 and 10 show that the orbit of the neutron star is most often too distant from the outer parts of the circumstellar disc. When it reaches its maximum size (Rdisc ∼ 15 R⊙), the disc nearly fills its Roche lobe and, as a result, accretion from the disc can occur.
 |
Fig. 9. Radius of the circumstellar disc and the distance between the components in 4U 2206+54. |
 |
Fig. 10. Orbit of the neutron star and the circumstellar disc of 4U 2206+54. Red indicates the Hα-emitting circumstellar disc. The blue circle indicates the size of the mass donor. |
5. Spectropolarimetry of 4U 2206+54
5.1. Observed degree of the polarisation and position angle of 4U 2206+54
The observed degree of the polarisation and position angle for the wavelength range 4800–8200 Å are shown in Fig. 11. The position angle has a flat behaviour with no visible wavelength dependence. The average value of all the observed position angles of 4U 2206+54 in a synthetic V-band filter is PAobs = 38.2 ± 0.5.
 |
Fig. 11. Observed position angle and degree of polarisation towards 4U 2206+54. |
5.2. Interstellar polarisation towards 4U 2206+54
Figure 12 presents a 3D map of the linear polarisation of the stars within the 10 × 10 deg field around 4U 2206+54. The position angle of 4U 2206+54 is aligned with that of the stars in the same direction, as shown in the last column of Table 1.
 |
Fig. 12. Interstellar polarisation of the field stars around 4U 2206+54 (Heiles 2000). The degree of polarisation is proportional to the length of the orange bars. The horizontal bar in the bottom left indicates 4.0% polarisation. The colour of each star corresponds to its distance. The background image shows the 100 μm dust emission map (Schlegel et al. 1998). |
Two stars (2MASS 22075650+5432038 and 2MASS 22074905+5432344) in the direction of 4U 2206+54 were observed in order to determine the interstellar polarisation towards 4U 2206+54. The angular separation between each star and 4U 2206+54 is less than 2′. Table 1 provides the angular distance and the distance to these stars, while Fig. 13 shows the observed position angle and degree of polarisation towards these stars in the direction of 4U 2206+54. It is worth noting that the observed polarisation towards the stars is lower than that towards 4U 2206+54.
 |
Fig. 13. Observed position angle and degree of polarisation of the stars in the direction of 4U 2206+54. |
In the optical region, the degree of interstellar polarisation is a function of the wavelength (Serkowski et al. 1975):
 (6)
(6)
where Pmax is the peak of the interstellar polarisation at wavelength λmax. Table 2 presents the parameters of the Serkowski law for 2MASS 22075650+5432038 and 2MASS 22074905+5432344.
Parameters of the Serkowski law.
Figure 14 shows the QV − UV diagram of 4U 2206+54 and the stars in its direction. The differences between the position of 4U 2206+54 and that of these stars, together with the depolarisation effect clearly visible in the Hα emission line (Fig. 15), indicate the presence of intrinsic polarisation towards 4U 2206+54. We calculated the intrinsic polarisation towards 4U 2206+54 using the average Stokes Q and U values – Qavr. (V) and Uavr. (V) – of the stars in the direction of 4U 2206+54 as parameters for the interstellar polarisation. In Fig. 14 this set of average values, QUavr. (V), is presented in orange. For the intrinsic polarisation in the synthetic V-band filter of 4U 2206+54, we calculate Pint (V) (%) = 0.5 ± 0.2 at a position angle of PAint (V)≈47°.
 |
Fig. 14. QV − UV diagram of 4U 2206+54 and the stars in the direction of 4U 2206+54. |
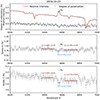 |
Fig. 15. Depolarisation effect in the Hα emission line of 4U 2206+54. |
5.3. Depolarisation effect in the Hα emission line and the intrinsic polarisation towards 4U 2206+54
The depolarisation effect in 4U 2206+54 is clearly visible in the data obtained on 23 October 2019. Figure 15 displays, from top to bottom, the degree of polarisation, the relative intensity, and the Stokes Q (%) and Stokes U (%) parameters. We used the depolarisation effect and the values of the areas marked in dark red and blue to calculate the intrinsic polarisation towards 4U 2206+54, obtaining Pint (%)≈0.15 at the position angle of PAint ≈ 27°. Nevertheless, the depolarisation effect in Stokes Q (%) is not clearly visible. Therefore, the position angle could be PAint ≈ 45° if the depolarisation effect occurs only in Stokes U. The differences in the degree of intrinsic polarisation obtained via the two methods can be explained by the intrinsic polarisation in the Hα emission line or by inaccuracies in the interstellar polarisation obtained from the stars in the direction of 4U 2206+54.
6. Discussion
Estimating the size of circumstellar discs around Be/X-ray binaries has significant implications for studying the X-ray activity that occurs when material is transferred to the compact object. Be/X-ray binaries display two types of X-ray outbursts: type I and type II. Type I outbursts are periodic, peaking at or close to the periastron passage of the compact object. Type II outbursts are more powerful, do not show any preferred orbital phase, and last for a large fraction of an orbital period or even several orbital periods (Reig 2011; Okazaki et al. 2013). Neither type of X-ray outburst is observed for 4U 2206+54. Instead, its X-ray light curve indicates persistent emission with luminosities LX ≃ 1035 − 1036 erg s−1 and variability on timescales of hours, akin to wind-fed systems (Ribó et al. 2006). Bearing in mind the peculiarities that set this system apart from classical Be/X-ray binaries, 4U 2206+54 is considered the best candidate for a new class of high-mass X-ray binaries: accreting magnetars (Reig 2012; Igoshev & Popov 2018; Tong & Wang 2019). This classification rules out the presence of a circumstellar disc around the donor in 4U 2206+54. In this case, most of the matter accreted onto the compact object likely originates from the stellar wind. Emission lines in the optical spectra, together with spectropolarimetric observations, indicate the presence of a circumstellar disc, which is likely very small. Our estimates of the circumstellar disc size and the distance between the components (Sect. 4) support the idea that there is no accretion from the outer parts of the disc.
Accretion onto a magnetic, rotating object is strongly affected by the interaction with its magnetic field. The matter in the accretion disc can rotate faster or more slowly than the magnetosphere depending on the corotation radius. The corotation radius of the neutron star is
 (7)
(7)
The radius of its magnetosphere (the Alfvén radius) is
 (8)
(8)
In the standard theory of gravimagnetic rotators, for a neutron star to be an accretor, the magnetosphere radius must be smaller than the corotation radius: Rm ≤ Rcor (Lipunov 1987; Campana et al. 2018). Assuming Rns = 10 km and that the X-ray flux is equal to the accretion luminosity, we used the following equation,
 (9)
(9)
Based on this, we estimate the mass accretion rate to be between 8.6 × 10⁻¹² and 8.6 × 10⁻¹¹ M⊙ yr−1. We calculate Rcor ≈ 0.75 R⊙ and Rm to be between 0.04 and 0.27 R⊙. In such a case, gravity dominates. As a result, matter can enter the magnetosphere, get attached to the field lines, and proceed towards the surface of the neutron star in a near free fall.
7. Conclusion
We present results from the high-resolution optical spectroscopy and spectropolarimetry of the peculiar high-mass X-ray binary 4U 2206+54. We summarise these results as follows:
-
We measured various parameters of the Hα emission line. Despite the lack of detected periodicities, our analysis reveals variability in some key line parameters, offering valuable insights into the long-term behaviour of Be/X-ray binaries.
-
The estimated outer radius of the Hα-emitting circumstellar disc ranges from 7.9 to 15.2 R⊙, with an average value of 10.9 R⊙. The distance between the components at periastron is ∼30.5 R⊙. This implies that the orbit of the neutron star is often too distant from the circumstellar disc to accrete large amounts of material.
-
The dominant component of the observed polarisation towards 4U 2206+54 is interstellar. A depolarisation effect in the Hα emission line is visible, indicating intrinsic polarisation. Two methods for determining the interstellar polarisation towards 4U 2206+54 (i.e. the so-called field star method and a method based on the depolarisation effect of the Hα emission line) yield similar results.
-
The intrinsic degree of polarisation in the synthetic V band is Pint (V) (%) = 0.5 ± 0.2 at a position angle of PAint (V)≈47°. Overall, this study provides new observational evidence of a circumstellar disc in 4U 2206+54. While this system is an outlier among Be/X-ray binaries, our findings suggest it could serve as a key test case for understanding accreting magnetars in binary systems.
Acknowledgments
We are grateful to an anonymous referee for the helpful comments and suggestions. The research infrastructure this research was done with is funded by the Ministry of Education and Science of Bulgaria (support for the Bulgarian National Roadmap for Research Infrastructure). Y.N. acknowledges support by grant: KΠ-06-M88/1 “Interstellar medium – 3D distribution and physical characteristics”, by the Bulgarian National Science Fund. VH would like to thank Deutsche Forschungsgemeinschaft (DFG) for financial support through grant numbers NE 515/61-1 and 65-1. VH acknowledges support from the Yerevan State University in the framework of an internal grant.
References
- Astropy Collaboration (Robitaille, T. P., et al.) 2013, A&A, 558, A33 [NASA ADS] [CrossRef] [EDP Sciences] [Google Scholar]
- Bagnulo, S., Landolfi, M., Landstreet, J. D., et al. 2009, PASP, 121, 993 [Google Scholar]
- Bailer-Jones, C. A. L., Rybizki, J., Fouesneau, M., Demleitner, M., & Andrae, R. 2021, AJ, 161, 147 [Google Scholar]
- Balona, L. A. 2000, ASP Conf. Ser., 214, 1 [Google Scholar]
- Blay, P., Negueruela, I., Reig, P., et al. 2006, A&A, 446, 1095 [NASA ADS] [CrossRef] [EDP Sciences] [Google Scholar]
- Bonev, T., Markov, H., Tomov, T., et al. 2017, Bulg. Astron. J., 26, 67 [Google Scholar]
- Campana, S., Stella, L., Mereghetti, S., & de Martino, D. 2018, A&A, 610, A46 [NASA ADS] [CrossRef] [EDP Sciences] [Google Scholar]
- Chauville, J., Zorec, J., Ballereau, D., et al. 2001, A&A, 378, 861 [NASA ADS] [CrossRef] [EDP Sciences] [Google Scholar]
- Coe, M. J., Reig, P., McBride, V. A., Galache, J. L., & Fabregat, J. 2006, MNRAS, 368, 447 [Google Scholar]
- Corbet, R. H. D., Markwardt, C. B., & Tueller, J. 2007, ApJ, 655, 458 [NASA ADS] [CrossRef] [Google Scholar]
- Eggleton, P. P. 1983, ApJ, 268, 368 [Google Scholar]
- Finger, M. H., Ikhsanov, N. R., Wilson-Hodge, C. A., & Patel, S. K. 2010, ApJ, 709, 1249 [NASA ADS] [CrossRef] [Google Scholar]
- Grundstrom, E. D., Boyajian, T. S., Finch, C., et al. 2007, ApJ, 660, 1398 [NASA ADS] [CrossRef] [Google Scholar]
- Haigh, N. J., Coe, M. J., & Fabregat, J. 2004, MNRAS, 350, 1457 [NASA ADS] [CrossRef] [Google Scholar]
- Hambaryan, V., Stoyanov, K. A., Mugrauer, M., et al. 2022, MNRAS, 511, 4123 [NASA ADS] [CrossRef] [Google Scholar]
- Hanuschik, R. W. 2000, ASP Conf. Ser., 214, 518 [Google Scholar]
- Hanuschik, R. W., Kozok, J. R., & Kaiser, D. 1988, A&A, 189, 147 [NASA ADS] [Google Scholar]
- Heiles, C. 2000, AJ, 119, 923 [Google Scholar]
- Huang, S.-S. 1972, ApJ, 171, 549 [NASA ADS] [CrossRef] [Google Scholar]
- Hummel, W., & Dachs, J. 1992, A&A, 262, L17 [NASA ADS] [Google Scholar]
- Hummel, W., & Vrancken, M. 2000, A&A, 359, 1075 [NASA ADS] [Google Scholar]
- Igoshev, A. P., & Popov, S. B. 2018, MNRAS, 473, 3204 [Google Scholar]
- Ikhsanov, N. R., & Beskrovnaya, N. G. 2013, Astron. Rep., 57, 287 [NASA ADS] [CrossRef] [Google Scholar]
- Jain, C., Yadav, A., & Sharma, R. 2022, JApA, 43, 101 [Google Scholar]
- Jockers, K., Credner, T., Bonev, T., et al. 2000, Kinematika i Fizika Nebesnykh Tel Supplement, 3, 13 [NASA ADS] [Google Scholar]
- Lipunov, V. M. 1987, Astrophysics of neutron stars (New York: Springer) [Google Scholar]
- Okazaki, A. T., & Negueruela, I. 2001, A&A, 377, 161 [NASA ADS] [CrossRef] [EDP Sciences] [Google Scholar]
- Okazaki, A. T., Hayasaki, K., & Moritani, Y. 2013, PASJ, 65, 41 [NASA ADS] [Google Scholar]
- Porter, J. M. 1996, MNRAS, 280, L31 [NASA ADS] [CrossRef] [Google Scholar]
- Porter, J. M., & Rivinius, T. 2003, PASP, 115, 1153 [Google Scholar]
- Reig, P. 2011, Ap&SS, 332, 1 [Google Scholar]
- Reig, P. 2012, ASP Conf. Ser., 466, 25 [Google Scholar]
- Reig, P., Fabregat, J., & Coe, M. J. 1997, A&A, 322, 193 [NASA ADS] [Google Scholar]
- Reig, P., Torrejón, J. M., Negueruela, I., et al. 2009, A&A, 494, 1073 [NASA ADS] [CrossRef] [EDP Sciences] [Google Scholar]
- Reig, P., Torrejón, J. M., & Blay, P. 2012, MNRAS, 425, 595 [Google Scholar]
- Ribó, M., Negueruela, I., Blay, P., Torrejón, J. M., & Reig, P. 2006, A&A, 449, 687 [NASA ADS] [CrossRef] [EDP Sciences] [Google Scholar]
- Rivinius, T., Carciofi, A. C., & Martayan, C. 2013, A&ARv, 21, 69 [Google Scholar]
- Schlegel, D. J., Finkbeiner, D. P., & Davis, M. 1998, ApJ, 500, 525 [Google Scholar]
- Serkowski, K., Mathewson, D. S., & Ford, V. L. 1975, ApJ, 196, 261 [NASA ADS] [CrossRef] [Google Scholar]
- Stoyanov, K. A., Zamanov, R. K., Latev, G. Y., Abedin, A. Y., & Tomov, N. A. 2014, Astron. Nachr., 335, 1060 [NASA ADS] [CrossRef] [Google Scholar]
- Tody, D. 1993, ASP Conf. Ser., 52, 173 [NASA ADS] [Google Scholar]
- Tong, H., & Wang, W. 2019, MNRAS, 482, 4956 [Google Scholar]
- Torrejón, J. M., Kreykenbohm, I., Orr, A., Titarchuk, L., & Negueruela, I. 2004, A&A, 423, 301 [NASA ADS] [CrossRef] [EDP Sciences] [Google Scholar]
- Torrejón, J. M., Reig, P., Fürst, F., et al. 2018, MNRAS, 479, 3366 [CrossRef] [Google Scholar]
- Zamanov, R., Stoyanov, K., Martí, J., et al. 2013, A&A, 559, A87 [NASA ADS] [CrossRef] [EDP Sciences] [Google Scholar]
- Zamanov, R. K., Stoyanov, K. A., Stefanov, S. Y., Bode, M. F., & Minev, M. S. 2023, Astron. Nachr., 344, e20230022 [Google Scholar]
All Tables
Spectropolarimetric observations of 4U 2206+54 and the stars in the direction of 4U 2206+54.
All Figures
|
Fig. 1. Five examples of Hα emission line profiles. |
| In the text | |
|
Fig. 2. Long-term variability of the measured EWs of the Hα emission line. From top to bottom: EW(B), EW(R), EW(D), the ratio of EW(B) to EW(R), and EW(Hα). |
| In the text | |
|
Fig. 3. Long-term variability of the measured FWHMs of the Hα emission line. From top to bottom: FWHM(B), FWHM(R), FWHM(D), and the ratio of FWHM(B) to FWHM(R). |
| In the text | |
|
Fig. 4. Long-term variability of the RVs of the blue and red peaks, and the central dip of the Hα emission line. |
| In the text | |
|
Fig. 5. EWs of the Hα emission line folded using the orbital period of 4U 2206+54. |
| In the text | |
|
Fig. 6. FWHMs of the Hα emission line folded using the orbital period of 4U 2206+54. |
| In the text | |
|
Fig. 7. RVs of the Hα emission line folded using the orbital period of 4U 2206+54. |
| In the text | |
|
Fig. 8. Histogram of Rdisc values. The distribution peak corresponds to Rdisc ≈ 10.4 R⊙. The dashed red lines mark the resonance radii. |
| In the text | |
|
Fig. 9. Radius of the circumstellar disc and the distance between the components in 4U 2206+54. |
| In the text | |
|
Fig. 10. Orbit of the neutron star and the circumstellar disc of 4U 2206+54. Red indicates the Hα-emitting circumstellar disc. The blue circle indicates the size of the mass donor. |
| In the text | |
|
Fig. 11. Observed position angle and degree of polarisation towards 4U 2206+54. |
| In the text | |
|
Fig. 12. Interstellar polarisation of the field stars around 4U 2206+54 (Heiles 2000). The degree of polarisation is proportional to the length of the orange bars. The horizontal bar in the bottom left indicates 4.0% polarisation. The colour of each star corresponds to its distance. The background image shows the 100 μm dust emission map (Schlegel et al. 1998). |
| In the text | |
|
Fig. 13. Observed position angle and degree of polarisation of the stars in the direction of 4U 2206+54. |
| In the text | |
|
Fig. 14. QV − UV diagram of 4U 2206+54 and the stars in the direction of 4U 2206+54. |
| In the text | |
|
Fig. 15. Depolarisation effect in the Hα emission line of 4U 2206+54. |
| In the text | |
Current usage metrics show cumulative count of Article Views (full-text article views including HTML views, PDF and ePub downloads, according to the available data) and Abstracts Views on Vision4Press platform.
Data correspond to usage on the plateform after 2015. The current usage metrics is available 48-96 hours after online publication and is updated daily on week days.
Initial download of the metrics may take a while.