Fig. 5.
Download original image
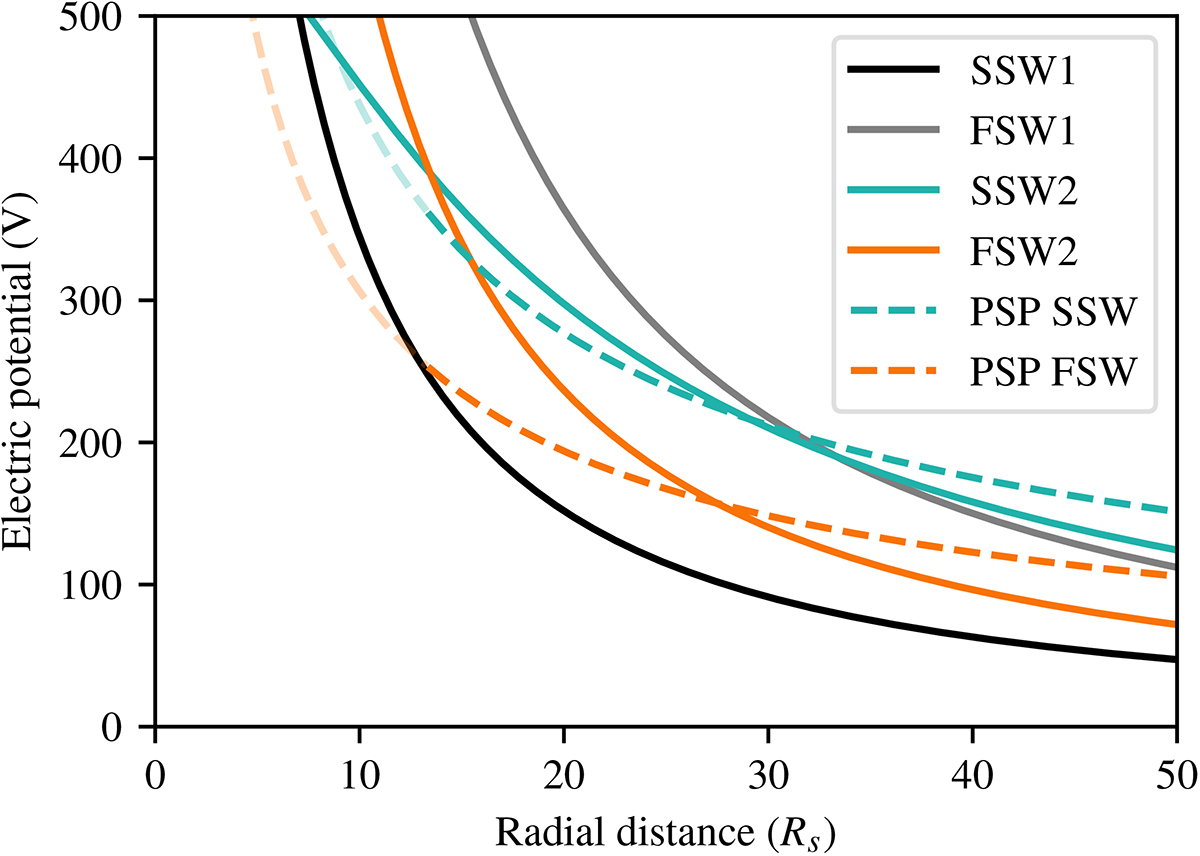
Radial evolution of the electric potential with respect to infinity. The solid lines are the electric potential retrieved by the exospheric model with the input parameters from Table 2. The corresponding solar wind terminal velocities of our model are approximately: 320 km s−1 for SSW1, 280 km s−1 for SSW2, 640 km s−1 for FSW1, and 520 km s−1 for FSW2. The dashed lines correspond to the SSW (blue) and FSW (orange) limits fitted to PSP data between 13.3 and 50 Rs (encounters 3–11) by Halekas et al. (2022). The dashed blue line is the fit of solar wind data with asymptotic speeds of 200–250 km s−1, while the dashed orange line corresponds to asymptotic speeds of 600–650 km s−1.
Current usage metrics show cumulative count of Article Views (full-text article views including HTML views, PDF and ePub downloads, according to the available data) and Abstracts Views on Vision4Press platform.
Data correspond to usage on the plateform after 2015. The current usage metrics is available 48-96 hours after online publication and is updated daily on week days.
Initial download of the metrics may take a while.