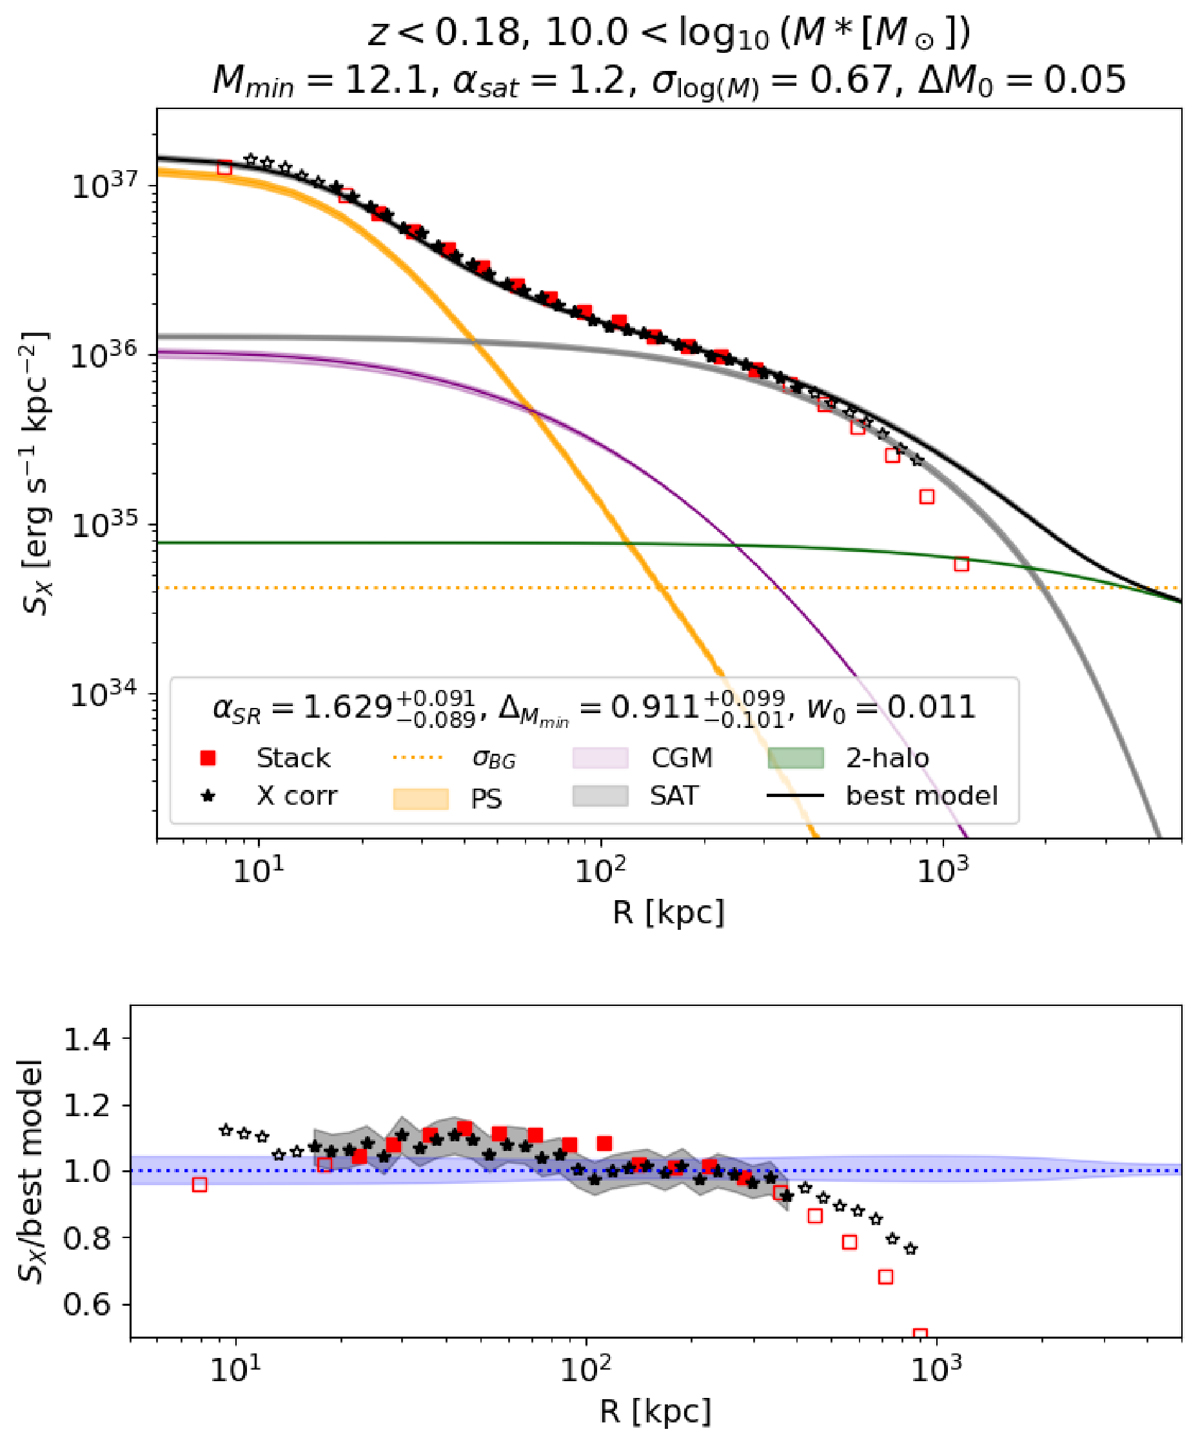
Fig. 8.
Download original image
Best-fit model for the galaxy X-ray cross-correlation obtained with the stellar mass-selected sample with mass M* > 1010 M⊙ (10.0). The black star (red square) symbols indicate the data points obtained with the estimator from the LS93 estimator, see Eq. (2) (DP83 estimator, Eq. (3)). The symbols are filled in the range where good agreement is obtained between estimators. These values are used for fitting the model. Empty symbols are measurements outside of that range. They are not used for fitting. We compare the observed cross-correlation (black stars) and stacks (red squares) to the best-fit model (black line) and its components: circumgalactic medium (purple), point sources (yellow), satellites (grey), and two-halo term (green). The uncertainties are 1σ. The HOD parameters used are fixed at the median of the best-fit model. We indicate the values in the title. The median best-fit cross-correlation parameters are indicated in the legend title (and in Table 4). The reduced χ2 is 0.918, indicating that the model accounts for the data. The horizontal dotted line shows the uncertainty on the background determination for this sample. The observed cross-correlation is dominated at small separation by the point source emission, then at larger separation by the emission of the hot gas hosted by large halos (M200m > 1014 M⊙) seen from the positions of satellite galaxies. Beyond separations of 3 Mpc, the two-halo term dominates. The contribution to the total emission of average emission from the hot gas in distinct halos hosting central galaxies in the inner 200 kpc varies between 5 and 15%. We show the ratio of the cross-correlation (stack) and the best-fit model in the bottom panel. In the range of 20–400 kpc, the residuals are consistent with the model within 1σ uncertainties. Outside of the fitting range, on small scales, the cross-correlation is up to 20% larger than the best-fit model. On large scales, at 1Mpc, the measurements are smaller than the best-fit model by 10–20%. The result for the other samples are shown in Figs. 9 and 10.
Current usage metrics show cumulative count of Article Views (full-text article views including HTML views, PDF and ePub downloads, according to the available data) and Abstracts Views on Vision4Press platform.
Data correspond to usage on the plateform after 2015. The current usage metrics is available 48-96 hours after online publication and is updated daily on week days.
Initial download of the metrics may take a while.