Fig. 13.
Download original image
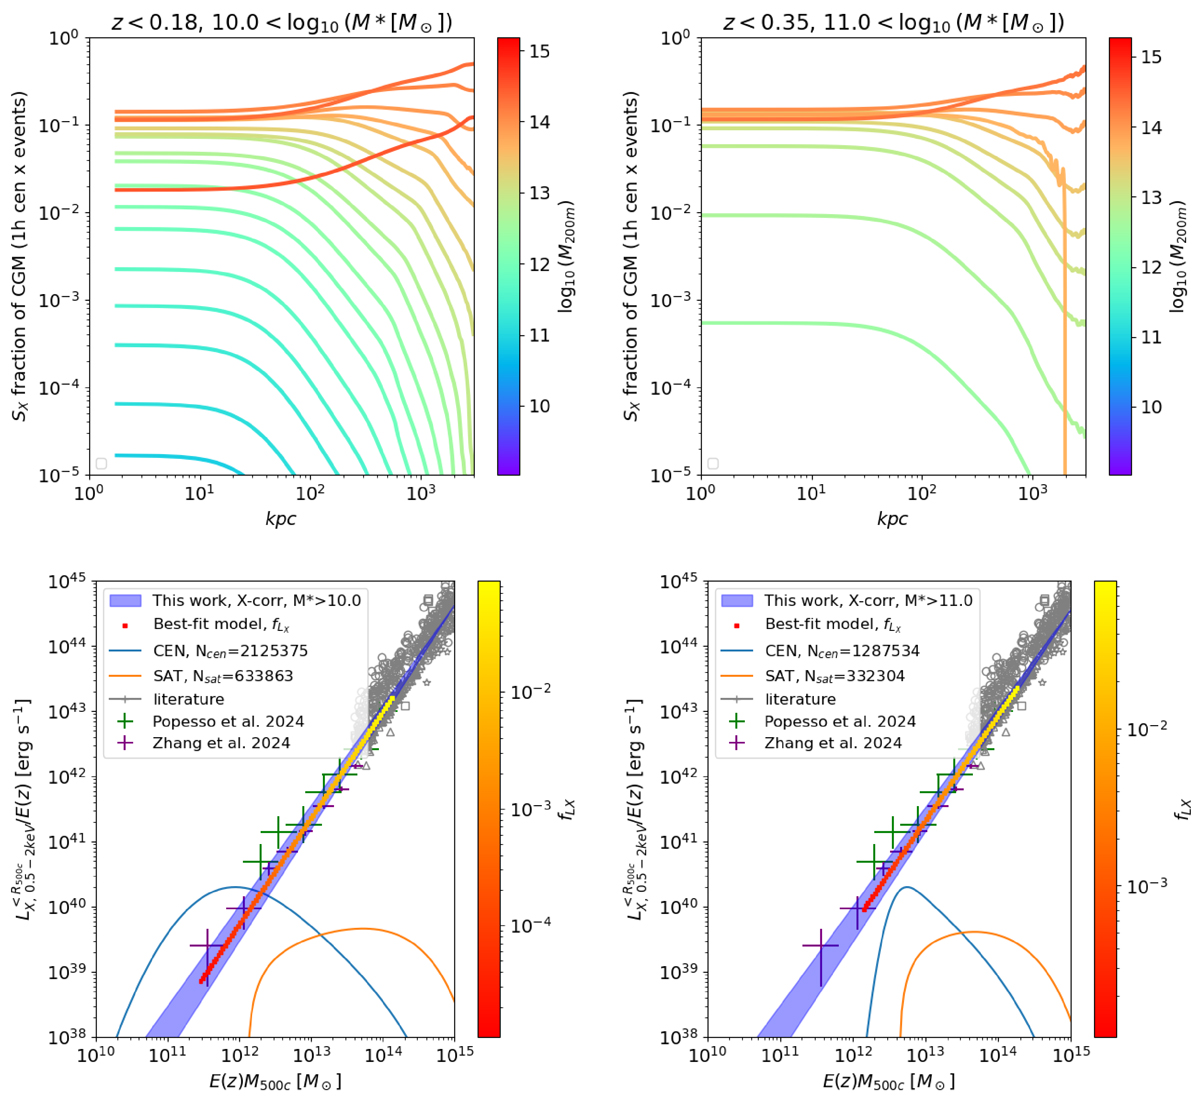
Top: Decomposition in fractions of the average hot gas model surface brightness profile (see Fig. 12) as a function of radius (separation in proper kpc) and halo mass (colorbar) for the samples with log10(M*/M⊙) > 10 (left column) and with log10(M*/M⊙) > 11 (right column). It shows the different origin of the average emission as a function of separation. The emission at large separation is clearly dominated by higher mass distinct halos. At small separations, smaller distinct halos also contribute to the average signal. Bottom: Scaling relation between mass and X-ray luminosity. The posterior on the scaling relation obtained from fitting the cross-correlation (mainly sensitive to its slope) is depicted by the blue shaded area. On the left (right) panel, the width of the contour corresponds to the uncertainty on the scaling relation slope: ![]() (
(![]() ). The shaded area overlaps with literature measurements shown with crosses and gray symbols (Lovisari et al. 2015, 2020; Mantz et al. 2016; Adami et al. 2018; Schellenberger & Reiprich 2017; Bulbul et al. 2019; Liu et al. 2022; Zhang et al. 2024b; Popesso et al. 2024b). Each galaxy sample is hosted by different populations of dark matter halos. The posterior normalized distribution (multiplied by 2 × 1040 so that it appears in the panel) of halo masses, obtained with the HOD model, hosting central (satellite) galaxies is shown at the bottom of the panel with a blue (orange) solid line. It shows that the constraint on the slope comes mostly from the central (satellite) galaxies at low (high) halo mass. Fitting for a complete sample (including satellite) gives stronger constraints than using central galaxies alone, that are hampered by small statistics at high mass. The integrated X-ray luminosity (one-halo central, see decomposition on the top row of panels) at a given halo mass contributes a fraction (fLX) to the average luminosity inferred (Table 4, last column) in the cross-correlation fit. This fraction is shown using the red-yellow color bar. On the bottom left panel, the color is limited to 10−5. The galaxies with halo masses smaller than 1011 M⊙ have almost no contribution to the average luminosity.
). The shaded area overlaps with literature measurements shown with crosses and gray symbols (Lovisari et al. 2015, 2020; Mantz et al. 2016; Adami et al. 2018; Schellenberger & Reiprich 2017; Bulbul et al. 2019; Liu et al. 2022; Zhang et al. 2024b; Popesso et al. 2024b). Each galaxy sample is hosted by different populations of dark matter halos. The posterior normalized distribution (multiplied by 2 × 1040 so that it appears in the panel) of halo masses, obtained with the HOD model, hosting central (satellite) galaxies is shown at the bottom of the panel with a blue (orange) solid line. It shows that the constraint on the slope comes mostly from the central (satellite) galaxies at low (high) halo mass. Fitting for a complete sample (including satellite) gives stronger constraints than using central galaxies alone, that are hampered by small statistics at high mass. The integrated X-ray luminosity (one-halo central, see decomposition on the top row of panels) at a given halo mass contributes a fraction (fLX) to the average luminosity inferred (Table 4, last column) in the cross-correlation fit. This fraction is shown using the red-yellow color bar. On the bottom left panel, the color is limited to 10−5. The galaxies with halo masses smaller than 1011 M⊙ have almost no contribution to the average luminosity.
Current usage metrics show cumulative count of Article Views (full-text article views including HTML views, PDF and ePub downloads, according to the available data) and Abstracts Views on Vision4Press platform.
Data correspond to usage on the plateform after 2015. The current usage metrics is available 48-96 hours after online publication and is updated daily on week days.
Initial download of the metrics may take a while.